non expressing cd11b cells Search Results


93
Bio-Rad fitc cd11b
Figure 6. Flow cytometry analyses of APCs isolated from human and swine saphenous veins. A and B, Representative flow cytometry gating procedure of hAPC line #1 and sAPC line #1 at P5. Total cell populations and the single cells (singlets) were gated according to FSC-A vs SSC-A and FSC-A vs FSC-H parameters (i and ii). Viable cells were distinguished from dead cells using Fixable Viability Dye eFluor780 (iii) and further gated for selected antigens (iv through xi and iv through xiii). Pericyte, mesenchymal, endothelial, and hematopoietic markers were studied. The FMO control was used in the assessment and gating of CD146+ and PDGFRb+ cells, because of the use of multiple fluorochromes (vii through ix and viii through x). The same approach was used when studying the expression of CD45 and <t>CD11b</t> on sAPCs to exclude hematopoietic cell contamination in the cell culture system (xi through xiii). Data were acquired using FACSCantoII (BD Biosciences) or Novocyte 3000 flow cytometer (ACEA Biosciences, San Diego, CA, USA) and analyzed using the FlowJo v10.3 software. C and D, Flow cytometry histograms for each surface marker in representative hAPC (C) and sAPC lines (D). Negative control staining profiles are shown by the red histograms, whereas specific antibody staining profiles are shown by light blue histograms. Bar graphs show the meanSEM values of 3 hAPC and sAPC lines. E and F, Gating and histograms of fresh isolated swine PB-MNCs and swine PAEC line #1 at P5 used as positive control for the staining of hematopoietic and endothelial markers, respectively. In both cell lines, the negative control staining profile is shown by full red histogram, while the positive staining profile is shown by full light-blue histogram. FSC-A indicates Forward Scatter Area; FSC-H, Forward Scatter Height; FMO, fluorescence minus 1; hAPCs, human adventitial pericytes; PB-MNCs, Peripheral blood mononuclear cells; PDGFRb, platelet-derived growth factor receptor-b; sAPCs, swine adventitial pericytes.
Fitc Cd11b, supplied by Bio-Rad, used in various techniques. Bioz Stars score: 93/100, based on 1 PubMed citations. ZERO BIAS - scores, article reviews, protocol conditions and more
https://www.bioz.com/product/non+expressing+cd11b+cells/Mouse+anti+Human+CD11b/10__1161_slash_jaha__117__006727-566-39-49
Average 93 stars, based on 1 article reviews
fitc cd11b - by Bioz Stars, 2026-11
93/100 stars
  Buy from Supplier

94
Revvity cd11b
(A) Timeline for using Cx3cr1 CreER driver to target myeloid cell inducible Tgfb1 loss (samples were harvested at 3 weeks post TAM). (B) Gating strategy for identifying the myeloid cells in single-cell suspension. Cells were first gated according to FSC-SSC, then restricted to singles cells and live cells. Myeloid cells were identified as CD45+ <t>CD11b+.</t> (C, D) FACS analyses of TGF-β expression by myeloid cells in the spleen (top histograms) and in the CNS (lower histograms). The fluorescence minus one (FMO) is represented in black histograms and TGF-β immunostaining is shown in red. TGF-β staining above the background (FMO) is shown in solid red and represents the percentage shown for each analysis. (E, F) Compilation of TGF-β expression by flow cytometry on myeloid cells from the spleen and CNS of WT and KO mice. (G) ELISA quantification (pg/µg total protein) from serum and tissue from the spleen and brain (n = 3 mice per group) showing no difference in TGF-β protein levels in serum or spleen of Cx3cr1CreER- tgfb1 iKO or control mice and that the brain TGF-β ligand levels are below the detection limit of the kit. Mean±SE, Student’s t-test (each data point represents a single animal).
Cd11b, supplied by Revvity, used in various techniques. Bioz Stars score: 94/100, based on 1 PubMed citations. ZERO BIAS - scores, article reviews, protocol conditions and more
https://www.bioz.com/product/non+expressing+cd11b+cells/TGF-%CE%B21/bio_rxiv__2023__07__05__547814-297-6-15
Average 94 stars, based on 1 article reviews
cd11b - by Bioz Stars, 2026-11
94/100 stars
  Buy from Supplier

90
Becton Dickinson anti-cd11b
(A) Daily oral laquinimod treatment reverses relapsing remitting EAE. SJL/J mice were immunized with PLP p139-151 and treated with laquinimod or vehicle (n = 9) at the remission phase (arrow points to the start of the treatment). (B) Lesion quantification showed reduced total number of meningeal and parenchymal inflammatory foci in SJL/J mice treated with laquinimod after first exacerbation of the disease. Representative Luxol fast blue-H&E staining of the cerebellum is shown. (C, D) Laquinimod-treated myeloid APC inhibit differentiation of naive T cells into Th1 and Th17 cells. Whole splenic in vivo laquinimod-treated or untreated <t>CD11b</t> + cells were used as APC in co-culture with untreated naive (CD4 + CD44 − CD62L + ) T cells from MOG p35-55 TCR-transgenic mice (2D2). Conversely, naive T cells were isolated from laquinimod- or vehicle-treated 2D2 mice and cultured with purified vehicle-treated CD11b + cells and Ag (MOG p35-55). Polarization of naïve T cells into Th1 lineage was induced by IL-12 (C) and polarization into Th17 lineage was induced by IL-23, IL-6 and TGF-β (D). Intracellular cytokine staining for IFN-γ and IL-17 after three days in culture is shown. For all experiments, data shown are representative of two independent experiments. For EAE disease course and other experiments, mean disease score and mean ± s.e.m. are displayed; *P<0.05, Mann-Whitney U test.
Anti Cd11b, supplied by Becton Dickinson, used in various techniques. Bioz Stars score: 90/100, based on 1 PubMed citations. ZERO BIAS - scores, article reviews, protocol conditions and more
https://www.bioz.com/product/non+expressing+cd11b+cells/anti+cd3/pmc03316495-136-10-14
Average 90 stars, based on 1 article reviews
anti-cd11b - by Bioz Stars, 2026-11
90/100 stars
  Buy from Supplier

94
Novus Biologicals nb110 89474af405 anti mouse cd11c novus biologicals
Figure 4. BIRC2 Knockdown in Melanoma Cells Decreases Tumor Growth and Alters Inflammatory Cell Recruitment to the Tumor Micro- environment (A) B16F10 subclones expressing NTC or BIRC2 shRNA (sh3 or sh4) were implanted subcutaneously in female C57BL/6 mice, and tumor growth was monitored. (B–F) Tumors were harvested on day 35 and the percentage of CD8+/CD44+/CD69+ activated T cells (B), CD11b+/NK1.1+ NK cells (C), <t>CD11b+/CD11c+/F4/80</t>
Nb110 89474af405 Anti Mouse Cd11c Novus Biologicals, supplied by Novus Biologicals, used in various techniques. Bioz Stars score: 94/100, based on 1 PubMed citations. ZERO BIAS - scores, article reviews, protocol conditions and more
https://www.bioz.com/product/non+expressing+cd11b+cells/CD11b+Antibody+%5BAlexa+Fluor%C2%AE+405%5D/pm32846130-197-47-50
Average 94 stars, based on 1 article reviews
nb110 89474af405 anti mouse cd11c novus biologicals - by Bioz Stars, 2026-11
94/100 stars
  Buy from Supplier

96
Miltenyi Biotec cd11b micro beads
FR-targeting carbon nanospheres locate in tumor associated macrophages (TAMs) in the tumor environment obtained from the subcutaneous GL261 tumor model. The TAMs are isolated using magnetically labeled <t>CD11b-associated</t> micro-beads. (A) Scheme showing the separation method for TAM isolation from a solid tumor. (B) Flow cytometric analyses of tumor-associated surface marker expressions on TAMs isolated from a subcutaneous GL261 tumor in mice. Expression levels of different surface markers (red) on TAMs and their corresponding subtype IgG controls (black) are represented accordingly. (C) The percentages of CD11b + and F4/80+ macrophages simultaneously expressing FRs. (D) Flow cytometric analysis of TAMs isolated from tumor-bearing mice treated with CFD (green), CD (red) and DOX (black). (E) Flow cytometric analysis of differences in CFD uptake in TAMs (green) and TAM-free, isolated tumour cells (blue) from the tumor-bearing mice. (F) Flow cytometric analysis to exhibit the differences in FR-expression levels in TAMs (green) and TAM-free, isolated tumour cells (blue) from the tumor-bearing mice. (G) Confocal microscopy images of TAMs isolated from CFD-, CD- or DOX-treated tumor-bearing mice.
Cd11b Micro Beads, supplied by Miltenyi Biotec, used in various techniques. Bioz Stars score: 96/100, based on 1 PubMed citations. ZERO BIAS - scores, article reviews, protocol conditions and more
https://www.bioz.com/product/non+expressing+cd11b+cells/CD11b+MicroBeads%2C+human+and+mouse+-+lyophilized/pmc09417975-53-29-33
Average 96 stars, based on 1 article reviews
cd11b micro beads - by Bioz Stars, 2026-11
96/100 stars
  Buy from Supplier

94
Miltenyi Biotec nhp
( A ) Brain tissue pieces were collected from the indicated brain regions and dissociated by mechanical disruption and enzymatic digestion. A CNS single-cell suspension was generated after Percoll separation. CD3 + T cells were positively selected and used for a CNS T cell QVOA. BrMCs and MG were isolated from the CD3 – fractions <t>by</t> <t>CD11b</t> + selection and by TMEM119 + selection, respectively. For human brains, CD11b + selection was performed to isolate BrMCs. BrMCs or MG at P0 (collected immediately after isolation) were used for purity and phenotype analysis and for RT-qPCR to measure proviral DNA and cell-associated RNA. BrMCs or MG at P1 were cultured 1–2 weeks ex vivo to allow the cells to recover and attach. P1 cells were used for the LRA study and the QVOA. ( B ) MG isolated from ART-suppressed, SIV-infected rhesus macaques were defined by TMEM119 staining (P1 MG) (scale bar: 100 μm) and ( C ) anti-TMEM119/anti-CD11b flow cytometry (P0 MG). ( D ) <t>NHP</t> MG proliferated ex vivo. ( E ) Total and integrated SIV DNA was detectable in isolated P0 MG ( n = 3). ( F ) SIV RNA was induced in isolated P1 MG 7 days after stimulation by the HDACi SAHA (500 nM), but was poorly induced by the canonical NF-κB agonist PEP005 (12 nM), the noncanonical NF-κB agonist AZD5582 (100 nM), or TNF-α (50 ng/mL). *** P < 0.001 compared with mock treatment, by 1-way ANOVA ( n = 3). ( G ) SIV RNA was recovered from the supernatant of NHP P1 MG cocultured with CEM174 ( n = 3). Data are presented as the mean ± SEM.
Nhp, supplied by Miltenyi Biotec, used in various techniques. Bioz Stars score: 94/100, based on 1 PubMed citations. ZERO BIAS - scores, article reviews, protocol conditions and more
https://www.bioz.com/product/non+expressing+cd11b+cells/CD11b+MicroBeads%2C+non-human+primate/pmc10266791-229-5-8
Average 94 stars, based on 1 article reviews
nhp - by Bioz Stars, 2026-11
94/100 stars
  Buy from Supplier

96
Santa Cruz Biotechnology cd11b fitc
Isolation of glass-adherent <t>CD11b+</t> macrophages from peripheral blood mononuclear cells (PBMCs). The PBMCs were cultured in a glass dish and cell specific phenotypes were analyzed. “Before’ refers to the phenotype analysis in the freshly collected PBMCs; ‘After’ refer to the phenotype analysis of the glass-adherent cells following 72 h culture and removal of the supernatant and non-adherent cells. After 72 h, the adherent cells were washed three times with fresh RPMI media and used in our further studies to determine the salt-effects. Increased macrophage phenotype (CD11b, A) in the adherent cells, along with decreased CD4+T cells (B), CD8+T cells (C), CD19+B cells (D), CD56+NK cells (E) and MPO (F, myeloperoxidase, leukocyte marker) in the adherent cells. Data represented mean values ± SEM from five independent experiments. Student- t -test performed for statistical analysis (significance p<0.05).
Cd11b Fitc, supplied by Santa Cruz Biotechnology, used in various techniques. Bioz Stars score: 96/100, based on 1 PubMed citations. ZERO BIAS - scores, article reviews, protocol conditions and more
https://www.bioz.com/product/non+expressing+cd11b+cells/FITC+Antibody/pmc04877052-41-7-13
Average 96 stars, based on 1 article reviews
cd11b fitc - by Bioz Stars, 2026-11
96/100 stars
  Buy from Supplier

95
Miltenyi Biotec anti mouse cd11b macs beads
PTEC DN-RAR mice underwent rhabdo or bilateral IRI-AKI, and kidneys harvested after 3 days. A-D, Increased F4/80 staining in the kidney after rhabdo- and IRI-AKI. A/B, F4/80 staining in uninjured mice (Ctrl) and after rhabdo-AKI (Rh-AKI). Area staining with F4/80 in the OSOM, and representative images showing F4/80, Sox9, and LTL staining. Left hand panels show F4/80 staining is largely restricted to the OSOM. Right hand panels show higher magnification of the OSOM. C/D, F4/80 staining after bilateral IRI-AKI. Quantification, and images showing F4/80 and LTL staining in the OSOM. Results expressed as means +/- SEM, individual data points shown. A/C, 1-way ANOVA, if p <0.05, q values shown for between group comparisons. Scale bars=100μM. E-F, Decreased expression of inflammatory markers in <t>CD11B+</t> cells after IRI-AKI. PTEC DN-RAR mice underwent bilateral IRI-AKI, and bulk RNA seq performed on renal CD11B + cells 3 days after injury. E, Gene set enrichment analysis (GSEA) of downregulated genes using Gene Ontology (GO) datasets. F, GSEA for validated pro-inflammatory (“M1”), and anti-inflammatory (“M2”) gene sets in the RNA seq data. Set size=no. of genes from each gene set that are represented. NES=normalized expression score for the gene set sizes. G/H, Volcano plots showing fold change in expression of core enrichment gene from the CD11B+ bulk RNA seq dataset. Dotted line indicates p<0.05.
Anti Mouse Cd11b Macs Beads, supplied by Miltenyi Biotec, used in various techniques. Bioz Stars score: 95/100, based on 1 PubMed citations. ZERO BIAS - scores, article reviews, protocol conditions and more
https://www.bioz.com/product/non+expressing+cd11b+cells/CD11b+MicroBeads+UltraPure%2C+mouse/bio_rxiv__2023__06__15__545113-208-5-9
Average 95 stars, based on 1 article reviews
anti mouse cd11b macs beads - by Bioz Stars, 2026-11
95/100 stars
  Buy from Supplier

95
Miltenyi Biotec cd11c
PTEC DN-RAR mice underwent rhabdo or bilateral IRI-AKI, and kidneys harvested after 3 days. A-D, Increased F4/80 staining in the kidney after rhabdo- and IRI-AKI. A/B, F4/80 staining in uninjured mice (Ctrl) and after rhabdo-AKI (Rh-AKI). Area staining with F4/80 in the OSOM, and representative images showing F4/80, Sox9, and LTL staining. Left hand panels show F4/80 staining is largely restricted to the OSOM. Right hand panels show higher magnification of the OSOM. C/D, F4/80 staining after bilateral IRI-AKI. Quantification, and images showing F4/80 and LTL staining in the OSOM. Results expressed as means +/- SEM, individual data points shown. A/C, 1-way ANOVA, if p <0.05, q values shown for between group comparisons. Scale bars=100μM. E-F, Decreased expression of inflammatory markers in <t>CD11B+</t> cells after IRI-AKI. PTEC DN-RAR mice underwent bilateral IRI-AKI, and bulk RNA seq performed on renal CD11B + cells 3 days after injury. E, Gene set enrichment analysis (GSEA) of downregulated genes using Gene Ontology (GO) datasets. F, GSEA for validated pro-inflammatory (“M1”), and anti-inflammatory (“M2”) gene sets in the RNA seq data. Set size=no. of genes from each gene set that are represented. NES=normalized expression score for the gene set sizes. G/H, Volcano plots showing fold change in expression of core enrichment gene from the CD11B+ bulk RNA seq dataset. Dotted line indicates p<0.05.
Cd11c, supplied by Miltenyi Biotec, used in various techniques. Bioz Stars score: 95/100, based on 1 PubMed citations. ZERO BIAS - scores, article reviews, protocol conditions and more
https://www.bioz.com/product/non+expressing+cd11b+cells/CD11c+Antibody%2C+anti-mouse%2C+REAfinity/pm37856828__nn3c04111_si_001-46-25-35
Average 95 stars, based on 1 article reviews
cd11c - by Bioz Stars, 2026-11
95/100 stars
  Buy from Supplier

96
Miltenyi Biotec cd11b magnetic cell separation
( A ) Schematic mechanism of action of afatinib, UNC2025, and pemigatinib. ( B ) Ccl2 , Ccl5 , Tnf , Nos2 , Lif , and Ngf expression, quantified by reverse transcriptase qPCR (RT-qPCR) in primary mouse astrocytes after stimulation (stim) with TNF-α and IL-1β, IL-6, IFN-γ, or GM-CSF with or without afatinib, UNC2025, and pemigatinib; n = 4 per group. Two-way ANOVA with Dunnett’s multiple comparisons test. ( C ) iNOS, TNF-α, GM-CSF, and Ki-67 were quantified by intracellular flow cytometry of primary mouse astrocytes after stim with TNF-α and IL-1β with or without afatinib, UNC2025, and pemigatinib. Data are representative for n = 2 independent experiments with n = 4 per group. One-way ANOVA with Dunnett’s multiple comparisons test; data are reported as mean ± SD. ( D ) ELISA measurement of NGF and BDNF produced by primary mouse astrocytes after stim with TNF-α and IL-1β with or without afatinib, UNC2025, and pemigatinib; n = 2. One-way ANOVA with Dunnett’s multiple comparisons test; data are reported as mean ± SD. ( E ) CCL2 , NOS2 , and LIF expression quantified by RT-qPCR in human astrocytes with or without stim with TNF-α and IL-1β with or without afatinib, UNC2025, and pemigatinib; n = 4. One-way ANOVA with Dunnett’s multiple comparisons test; data are reported as mean ± SD. ( F ) Relative expression of Il6 , and Ccl2 in primary mouse microglia quantified by RT-qPCR after stim with ACM derived from unstimulated and stim (TNF-α and IL-1β) primary mouse astrocytes with or without afatinib, UNC2025, and pemigatinib; n = 3. One-way ANOVA with Dunnett’s multiple comparisons test; data are reported as mean ± SD. ( G ) Annexin V propidium iodide apoptosis assay of neuronal N2A cells stimulated with ACM; n = 3. Cells were categorized as in early or late apoptosis. One-way ANOVA with Dunnett’s multiple comparisons test; data are reported as mean ± SD. ( H ) Migration assay of <t>CD11b</t> + myeloid cells stimulated with ACM; n = 3. One-way ANOVA with Dunnett’s multiple comparisons test; data are reported as mean ± SD. * P < 0.05; ** P < 0.01; *** P < 0.001; **** P < 0.0001.
Cd11b Magnetic Cell Separation, supplied by Miltenyi Biotec, used in various techniques. Bioz Stars score: 96/100, based on 1 PubMed citations. ZERO BIAS - scores, article reviews, protocol conditions and more
https://www.bioz.com/product/non+expressing+cd11b+cells/CD11b+MicroBeads%2C+human+and+mouse/pmc09057609-138-13-18
Average 96 stars, based on 1 article reviews
cd11b magnetic cell separation - by Bioz Stars, 2026-11
96/100 stars
  Buy from Supplier

96
Vector Laboratories mouse igg1 anti cd11b
FIGURE 2 Representative images of skeletal muscle immunohistochemistry. (A) Skeletal muscle macrophages were identified using antibodies against <t>CD11b</t> (green) and CD206 (red); CD11b+/CD206+ cells were counted (white arrows). (B) Satellite cells were identified using a Pax7 antibody (red) within the laminin border (green); satellite cells were expressed per fiber. Muscle fiber cross-sectional area was measured in these images. (C) Myonuclei (gold arrows) were identified as DAPI+ (blue) nuclei within the dystrophin border (green). (D) Capillaries were identified using fluorescently conjugated lectin (pink) with a laminin antibody to outline fibers (green) and measured per fiber (yellow arrows). Scale bar = 100 μm for (A), (B), and (D); scale bar = 20 μm in (C)
Mouse Igg1 Anti Cd11b, supplied by Vector Laboratories, used in various techniques. Bioz Stars score: 96/100, based on 1 PubMed citations. ZERO BIAS - scores, article reviews, protocol conditions and more
https://www.bioz.com/product/non+expressing+cd11b+cells/Mouse+IgG+(Control+Antibody)/10__1096_slash_fj__202100182rr-46-4-17
Average 96 stars, based on 1 article reviews
mouse igg1 anti cd11b - by Bioz Stars, 2026-11
96/100 stars
  Buy from Supplier

96
Miltenyi Biotec microglial cells
( a-e ) Increasing numbers of MDMs in the injured spinal cord correlates with reduced phagocytosis by microglia. Myeloid cells were isolated from the uninjured or injured spinal cord of LysM-eGFP mice and immediately treated with pHrodo- labeled myelin for four hours. ( a ) Flow cytometry gates to isolate microglia/macrophage populations exclude Ly6G+ neutrophils. ( b-d ) Representative flow cytometry dot plots show proportions of CD11b + /LysM-eGFP −ve (microglia) and CD11b + /LysM-eGFP +ve (macrophages) in uninjured or SCI tissue, 1 and 3 d after injury. Bottom panels show representative plots of microglia positive for pHrodo-myelin. ( e ) Graph shows reduced phagocytosis by microglia, with increasing presence of MDMs post-SCI. ( f-i ) In vitro bilaminar coculture of adult mouse microglia and macrophages. Representative FACS plots show uptake of pHrodo-labeled myelin in microglia ( f ) or macrophages (Mϕ) ( h ) alone (left panels) or cells in coculture (right). Graphs showing that phagocytosis is significantly decreased in microglia in the presence of Mϕ compared to microglia alone ( g ), and significantly increased in macrophages in the presence of microglia ( i ). ( j-m ) The bilaminar culture system was used to assess microglia–macrophage communication on inflammatory gene expression in adult mouse and human cells. ( j ) Adult mouse <t>microglial</t> gene expression of four key inflammatory cytokines (IL-1β, TNF, IL-6, and IL-10) treated with LPS (100 ng/mL) in the presence or absence of macrophages (Mϕ). ( k ) Adult mouse macrophage gene expression in the presence or absence of adult mouse microglia. (l ) Adult human microglial gene expression in the presence or absence of human macrophages. ( m ) Adult human macrophage gene expression in the presence or absence of adult human microglia. Statistical analysis for ( e ), one-way ANOVA with Bonferroni corrections ( n = 3); ( g, i ) Student t test ( n = 4). ( j-m ) Two-way ANOVA with Bonferroni corrections ( n = 3–6), mean ± SEM, * p < 0.05; ** p < 0.01; *** p < 0.001. Corresponding raw data . FACS, fluorescently activated cell sorting; IL, interleukin; LPS, lipopolysaccharide; MDM, monocyte-derived macrophage; SCI, spinal cord injury; TNF, Tumor necrosis factor.
Microglial Cells, supplied by Miltenyi Biotec, used in various techniques. Bioz Stars score: 96/100, based on 1 PubMed citations. ZERO BIAS - scores, article reviews, protocol conditions and more
https://www.bioz.com/product/non+expressing+cd11b+cells/CD11b+(Microglia)+MicroBeads%2C+human+and+mouse/pmc06205650-194-14-21
Average 96 stars, based on 1 article reviews
microglial cells - by Bioz Stars, 2026-11
96/100 stars
  Buy from Supplier

Image Search Results


Figure 6. Flow cytometry analyses of APCs isolated from human and swine saphenous veins. A and B, Representative flow cytometry gating procedure of hAPC line #1 and sAPC line #1 at P5. Total cell populations and the single cells (singlets) were gated according to FSC-A vs SSC-A and FSC-A vs FSC-H parameters (i and ii). Viable cells were distinguished from dead cells using Fixable Viability Dye eFluor780 (iii) and further gated for selected antigens (iv through xi and iv through xiii). Pericyte, mesenchymal, endothelial, and hematopoietic markers were studied. The FMO control was used in the assessment and gating of CD146+ and PDGFRb+ cells, because of the use of multiple fluorochromes (vii through ix and viii through x). The same approach was used when studying the expression of CD45 and CD11b on sAPCs to exclude hematopoietic cell contamination in the cell culture system (xi through xiii). Data were acquired using FACSCantoII (BD Biosciences) or Novocyte 3000 flow cytometer (ACEA Biosciences, San Diego, CA, USA) and analyzed using the FlowJo v10.3 software. C and D, Flow cytometry histograms for each surface marker in representative hAPC (C) and sAPC lines (D). Negative control staining profiles are shown by the red histograms, whereas specific antibody staining profiles are shown by light blue histograms. Bar graphs show the meanSEM values of 3 hAPC and sAPC lines. E and F, Gating and histograms of fresh isolated swine PB-MNCs and swine PAEC line #1 at P5 used as positive control for the staining of hematopoietic and endothelial markers, respectively. In both cell lines, the negative control staining profile is shown by full red histogram, while the positive staining profile is shown by full light-blue histogram. FSC-A indicates Forward Scatter Area; FSC-H, Forward Scatter Height; FMO, fluorescence minus 1; hAPCs, human adventitial pericytes; PB-MNCs, Peripheral blood mononuclear cells; PDGFRb, platelet-derived growth factor receptor-b; sAPCs, swine adventitial pericytes.

Journal: Journal of the American Heart Association

Article Title: Transplantation of Allogeneic Pericytes Improves Myocardial Vascularization and Reduces Interstitial Fibrosis in a Swine Model of Reperfused Acute Myocardial Infarction

doi: 10.1161/jaha.117.006727

Figure Lengend Snippet: Figure 6. Flow cytometry analyses of APCs isolated from human and swine saphenous veins. A and B, Representative flow cytometry gating procedure of hAPC line #1 and sAPC line #1 at P5. Total cell populations and the single cells (singlets) were gated according to FSC-A vs SSC-A and FSC-A vs FSC-H parameters (i and ii). Viable cells were distinguished from dead cells using Fixable Viability Dye eFluor780 (iii) and further gated for selected antigens (iv through xi and iv through xiii). Pericyte, mesenchymal, endothelial, and hematopoietic markers were studied. The FMO control was used in the assessment and gating of CD146+ and PDGFRb+ cells, because of the use of multiple fluorochromes (vii through ix and viii through x). The same approach was used when studying the expression of CD45 and CD11b on sAPCs to exclude hematopoietic cell contamination in the cell culture system (xi through xiii). Data were acquired using FACSCantoII (BD Biosciences) or Novocyte 3000 flow cytometer (ACEA Biosciences, San Diego, CA, USA) and analyzed using the FlowJo v10.3 software. C and D, Flow cytometry histograms for each surface marker in representative hAPC (C) and sAPC lines (D). Negative control staining profiles are shown by the red histograms, whereas specific antibody staining profiles are shown by light blue histograms. Bar graphs show the meanSEM values of 3 hAPC and sAPC lines. E and F, Gating and histograms of fresh isolated swine PB-MNCs and swine PAEC line #1 at P5 used as positive control for the staining of hematopoietic and endothelial markers, respectively. In both cell lines, the negative control staining profile is shown by full red histogram, while the positive staining profile is shown by full light-blue histogram. FSC-A indicates Forward Scatter Area; FSC-H, Forward Scatter Height; FMO, fluorescence minus 1; hAPCs, human adventitial pericytes; PB-MNCs, Peripheral blood mononuclear cells; PDGFRb, platelet-derived growth factor receptor-b; sAPCs, swine adventitial pericytes.

Article Snippet: Antibodies used in flow cytometry studies on sAPCs Marker Permeabilization Reactivity Primary antibody source dilution Fluorophores CD90 No Swine eBioscience, 1:20 Pe-Cy7 CD44 No Swine eBioscience, 1:20 APC CD105 No Swine LifeSpan, 1:5 PE CD45 No Swine Serotec, 1:25 FITC CD11b No Human/Swine eBioscience, 1:20 Pe-Cy7 CD31 No Swine Serotec, 1:80 PE CD146 No Swine Serotec, 1:60 FITC PDGFR No Human Biolegend, 1:25 PE Dye eFluor 780 No eBioscience, 1:1000 APC-Cy7 Cells (1x10⁶, N=3 biological replicates) were washed in 1X DPBS (Life Technologies) and treated with 10X trypsin/EDTA (Life Technologies).

Techniques: Flow Cytometry, Isolation, Cytometry, Control, Expressing, Cell Culture, Software, Marker, Negative Control, Staining, Positive Control, Derivative Assay

(A) Timeline for using Cx3cr1 CreER driver to target myeloid cell inducible Tgfb1 loss (samples were harvested at 3 weeks post TAM). (B) Gating strategy for identifying the myeloid cells in single-cell suspension. Cells were first gated according to FSC-SSC, then restricted to singles cells and live cells. Myeloid cells were identified as CD45+ CD11b+. (C, D) FACS analyses of TGF-β expression by myeloid cells in the spleen (top histograms) and in the CNS (lower histograms). The fluorescence minus one (FMO) is represented in black histograms and TGF-β immunostaining is shown in red. TGF-β staining above the background (FMO) is shown in solid red and represents the percentage shown for each analysis. (E, F) Compilation of TGF-β expression by flow cytometry on myeloid cells from the spleen and CNS of WT and KO mice. (G) ELISA quantification (pg/µg total protein) from serum and tissue from the spleen and brain (n = 3 mice per group) showing no difference in TGF-β protein levels in serum or spleen of Cx3cr1CreER- tgfb1 iKO or control mice and that the brain TGF-β ligand levels are below the detection limit of the kit. Mean±SE, Student’s t-test (each data point represents a single animal).

Journal: bioRxiv

Article Title: Microglia-derived TGF-β1 ligand maintains microglia homeostasis via autocrine mechanism and is critical for normal cognitive function in adult mouse brain

doi: 10.1101/2023.07.05.547814

Figure Lengend Snippet: (A) Timeline for using Cx3cr1 CreER driver to target myeloid cell inducible Tgfb1 loss (samples were harvested at 3 weeks post TAM). (B) Gating strategy for identifying the myeloid cells in single-cell suspension. Cells were first gated according to FSC-SSC, then restricted to singles cells and live cells. Myeloid cells were identified as CD45+ CD11b+. (C, D) FACS analyses of TGF-β expression by myeloid cells in the spleen (top histograms) and in the CNS (lower histograms). The fluorescence minus one (FMO) is represented in black histograms and TGF-β immunostaining is shown in red. TGF-β staining above the background (FMO) is shown in solid red and represents the percentage shown for each analysis. (E, F) Compilation of TGF-β expression by flow cytometry on myeloid cells from the spleen and CNS of WT and KO mice. (G) ELISA quantification (pg/µg total protein) from serum and tissue from the spleen and brain (n = 3 mice per group) showing no difference in TGF-β protein levels in serum or spleen of Cx3cr1CreER- tgfb1 iKO or control mice and that the brain TGF-β ligand levels are below the detection limit of the kit. Mean±SE, Student’s t-test (each data point represents a single animal).

Article Snippet: These antibodies included: CD45 (clone 30-F11), CD11b (clone M1/70) and TGF-β1 (clone TW7-16B4) (all from Biolegend).

Techniques: Suspension, Expressing, Fluorescence, Immunostaining, Staining, Flow Cytometry, Enzyme-linked Immunosorbent Assay, Control

(A) Daily oral laquinimod treatment reverses relapsing remitting EAE. SJL/J mice were immunized with PLP p139-151 and treated with laquinimod or vehicle (n = 9) at the remission phase (arrow points to the start of the treatment). (B) Lesion quantification showed reduced total number of meningeal and parenchymal inflammatory foci in SJL/J mice treated with laquinimod after first exacerbation of the disease. Representative Luxol fast blue-H&E staining of the cerebellum is shown. (C, D) Laquinimod-treated myeloid APC inhibit differentiation of naive T cells into Th1 and Th17 cells. Whole splenic in vivo laquinimod-treated or untreated CD11b + cells were used as APC in co-culture with untreated naive (CD4 + CD44 − CD62L + ) T cells from MOG p35-55 TCR-transgenic mice (2D2). Conversely, naive T cells were isolated from laquinimod- or vehicle-treated 2D2 mice and cultured with purified vehicle-treated CD11b + cells and Ag (MOG p35-55). Polarization of naïve T cells into Th1 lineage was induced by IL-12 (C) and polarization into Th17 lineage was induced by IL-23, IL-6 and TGF-β (D). Intracellular cytokine staining for IFN-γ and IL-17 after three days in culture is shown. For all experiments, data shown are representative of two independent experiments. For EAE disease course and other experiments, mean disease score and mean ± s.e.m. are displayed; *P<0.05, Mann-Whitney U test.

Journal: PLoS ONE

Article Title: Laquinimod, a Quinoline-3-Carboxamide, Induces Type II Myeloid Cells That Modulate Central Nervous System Autoimmunity

doi: 10.1371/journal.pone.0033797

Figure Lengend Snippet: (A) Daily oral laquinimod treatment reverses relapsing remitting EAE. SJL/J mice were immunized with PLP p139-151 and treated with laquinimod or vehicle (n = 9) at the remission phase (arrow points to the start of the treatment). (B) Lesion quantification showed reduced total number of meningeal and parenchymal inflammatory foci in SJL/J mice treated with laquinimod after first exacerbation of the disease. Representative Luxol fast blue-H&E staining of the cerebellum is shown. (C, D) Laquinimod-treated myeloid APC inhibit differentiation of naive T cells into Th1 and Th17 cells. Whole splenic in vivo laquinimod-treated or untreated CD11b + cells were used as APC in co-culture with untreated naive (CD4 + CD44 − CD62L + ) T cells from MOG p35-55 TCR-transgenic mice (2D2). Conversely, naive T cells were isolated from laquinimod- or vehicle-treated 2D2 mice and cultured with purified vehicle-treated CD11b + cells and Ag (MOG p35-55). Polarization of naïve T cells into Th1 lineage was induced by IL-12 (C) and polarization into Th17 lineage was induced by IL-23, IL-6 and TGF-β (D). Intracellular cytokine staining for IFN-γ and IL-17 after three days in culture is shown. For all experiments, data shown are representative of two independent experiments. For EAE disease course and other experiments, mean disease score and mean ± s.e.m. are displayed; *P<0.05, Mann-Whitney U test.

Article Snippet: We evaluated monocyte and dendritic cell preparations for expression of CD11b, CD11c, B220, CD3 (BD Pharmingen, San Diego, CA).

Techniques: Staining, In Vivo, Co-Culture Assay, Transgenic Assay, Isolation, Cell Culture, Purification, MANN-WHITNEY

All experiments were conducted with myeloid-APC purified (purity ≥95%) by MACS sorting from mice treated with laquinimod or vehicle for ten days. (A) DC were isolated from the spleen and defined as CD11c high . Percentages of splenic CD11c high CD4 + cDC (CD4 + CD11b + ) from laquinimod-treated or vehicle-treated mice (n = 4), and percentage of total splenic CD4 + cells from laquinimod- and vehicle-treated mice (n = 5) are shown. (B) Splenic and blood CD11b + cells were stained for Gr1. Relative percentages of CD11b + Gr1 hi (arrow points to Gr1 hi cells) out of total splenic and blood CD11b + cells from mice treated with laquinimod (dark grey bar) or vehicle (white bar) is shown (n = 4). (C–E) Purified splenic CD11b + , CD11b + CD11c − (C, D) or CD11c + (E) cells were used as APC in co-culture with naïve CD4 + 2D2 T cells and Ag (MOG p35-55). Th1 and Th17 differentiation were induced as described above. Intracellular cytokine staining shows the percentage of IL-17 and IFN-γ after 3 days in culture (gate). (F) Purified splenic CD11b + CD11c − or CD11c + cells were used as APC in co-culture with naïve CD4 + 2D2 T cells under non-polarizing conditions. FACS analyses after four days in culture for IL-17 and IFN-γ and for Foxp3 by CD4 + cells is shown. Data shown as mean ± s.e.m. are representative of at least two independent experiments; *P<0.05, Mann-Whitney U test.

Journal: PLoS ONE

Article Title: Laquinimod, a Quinoline-3-Carboxamide, Induces Type II Myeloid Cells That Modulate Central Nervous System Autoimmunity

doi: 10.1371/journal.pone.0033797

Figure Lengend Snippet: All experiments were conducted with myeloid-APC purified (purity ≥95%) by MACS sorting from mice treated with laquinimod or vehicle for ten days. (A) DC were isolated from the spleen and defined as CD11c high . Percentages of splenic CD11c high CD4 + cDC (CD4 + CD11b + ) from laquinimod-treated or vehicle-treated mice (n = 4), and percentage of total splenic CD4 + cells from laquinimod- and vehicle-treated mice (n = 5) are shown. (B) Splenic and blood CD11b + cells were stained for Gr1. Relative percentages of CD11b + Gr1 hi (arrow points to Gr1 hi cells) out of total splenic and blood CD11b + cells from mice treated with laquinimod (dark grey bar) or vehicle (white bar) is shown (n = 4). (C–E) Purified splenic CD11b + , CD11b + CD11c − (C, D) or CD11c + (E) cells were used as APC in co-culture with naïve CD4 + 2D2 T cells and Ag (MOG p35-55). Th1 and Th17 differentiation were induced as described above. Intracellular cytokine staining shows the percentage of IL-17 and IFN-γ after 3 days in culture (gate). (F) Purified splenic CD11b + CD11c − or CD11c + cells were used as APC in co-culture with naïve CD4 + 2D2 T cells under non-polarizing conditions. FACS analyses after four days in culture for IL-17 and IFN-γ and for Foxp3 by CD4 + cells is shown. Data shown as mean ± s.e.m. are representative of at least two independent experiments; *P<0.05, Mann-Whitney U test.

Article Snippet: We evaluated monocyte and dendritic cell preparations for expression of CD11b, CD11c, B220, CD3 (BD Pharmingen, San Diego, CA).

Techniques: Purification, Isolation, Staining, Co-Culture Assay, MANN-WHITNEY

Laquinimod-induced anti-inflammatory cytokine shift in CD11b + CD11c − and CD11c + cells. (A) FACS analysis of intracellular production of TNF, IL12/23p40, IL-6 and IL-10 by CD11b + CD11c − and CD11c + cells isolated from spleens of naive (unimmunized) mice treated with laquinimod or vehicle. (B) Cell surface FACS analysis of MHC II, proinflammatory and inhibitory costimulatory molecules on CD11b + CD11c − cells. (C) In vivo laquinimod treatment affects signaling pathways that participate in proinflammatory cytokine production. Protein extracts were isolated from peritoneal macrophages of naïve C57BL/6 mice treated with laquinimod or vehicle and stimulated with LPS for various time points. Phosphorylated (P) STAT1, (P) p38-MAPK, Pan-STAT1 and Pan-p38-MAPK were detected by Western blot analysis. (D) CD11b + cells from laquinimod-treated donor mice reversed established EAE. 5×10 6 purified splenic CD11b + cells from mice treated with laquinimod or vehicle were injected i.v. into recipient C57BL/6 mice immunized with MOG p35–55 after they developed a disease grade of 2 (black arrow indicates time point of adoptive transfer, (n = 5/group). (E) Quantification showed reduced total number of inflammatory foci after adoptive transfer of in vivo laquinimod treated CD11b + cells into C57BL/6 mice immunized with MOG p35-55. Data shown in panels above are representative of three independent experiments. For EAE disease course, mean disease score ± s.e.m. are displayed; *P<0.05, **P<0.01 Mann-Whitney U test.

Journal: PLoS ONE

Article Title: Laquinimod, a Quinoline-3-Carboxamide, Induces Type II Myeloid Cells That Modulate Central Nervous System Autoimmunity

doi: 10.1371/journal.pone.0033797

Figure Lengend Snippet: Laquinimod-induced anti-inflammatory cytokine shift in CD11b + CD11c − and CD11c + cells. (A) FACS analysis of intracellular production of TNF, IL12/23p40, IL-6 and IL-10 by CD11b + CD11c − and CD11c + cells isolated from spleens of naive (unimmunized) mice treated with laquinimod or vehicle. (B) Cell surface FACS analysis of MHC II, proinflammatory and inhibitory costimulatory molecules on CD11b + CD11c − cells. (C) In vivo laquinimod treatment affects signaling pathways that participate in proinflammatory cytokine production. Protein extracts were isolated from peritoneal macrophages of naïve C57BL/6 mice treated with laquinimod or vehicle and stimulated with LPS for various time points. Phosphorylated (P) STAT1, (P) p38-MAPK, Pan-STAT1 and Pan-p38-MAPK were detected by Western blot analysis. (D) CD11b + cells from laquinimod-treated donor mice reversed established EAE. 5×10 6 purified splenic CD11b + cells from mice treated with laquinimod or vehicle were injected i.v. into recipient C57BL/6 mice immunized with MOG p35–55 after they developed a disease grade of 2 (black arrow indicates time point of adoptive transfer, (n = 5/group). (E) Quantification showed reduced total number of inflammatory foci after adoptive transfer of in vivo laquinimod treated CD11b + cells into C57BL/6 mice immunized with MOG p35-55. Data shown in panels above are representative of three independent experiments. For EAE disease course, mean disease score ± s.e.m. are displayed; *P<0.05, **P<0.01 Mann-Whitney U test.

Article Snippet: We evaluated monocyte and dendritic cell preparations for expression of CD11b, CD11c, B220, CD3 (BD Pharmingen, San Diego, CA).

Techniques: Isolation, In Vivo, Western Blot, Purification, Injection, Adoptive Transfer Assay, MANN-WHITNEY

Figure 4. BIRC2 Knockdown in Melanoma Cells Decreases Tumor Growth and Alters Inflammatory Cell Recruitment to the Tumor Micro- environment (A) B16F10 subclones expressing NTC or BIRC2 shRNA (sh3 or sh4) were implanted subcutaneously in female C57BL/6 mice, and tumor growth was monitored. (B–F) Tumors were harvested on day 35 and the percentage of CD8+/CD44+/CD69+ activated T cells (B), CD11b+/NK1.1+ NK cells (C), CD11b+/CD11c+/F4/80

Journal: Cell reports

Article Title: BIRC2 Expression Impairs Anti-Cancer Immunity and Immunotherapy Efficacy.

doi: 10.1016/j.celrep.2020.108073

Figure Lengend Snippet: Figure 4. BIRC2 Knockdown in Melanoma Cells Decreases Tumor Growth and Alters Inflammatory Cell Recruitment to the Tumor Micro- environment (A) B16F10 subclones expressing NTC or BIRC2 shRNA (sh3 or sh4) were implanted subcutaneously in female C57BL/6 mice, and tumor growth was monitored. (B–F) Tumors were harvested on day 35 and the percentage of CD8+/CD44+/CD69+ activated T cells (B), CD11b+/NK1.1+ NK cells (C), CD11b+/CD11c+/F4/80

Article Snippet: REAGENT or RESOURCE SOURCE IDENTIFIER Antibodies Anti-mouse BIRC2 Novus Biologicals Cat# NB100-56889 Anti-mouse b-Actin Santa Cruz Biotechnology Cat# sc-47778 Anti-mouse CD3 BioLegend Cat# 102102 Anti-mouse CD3 Novus Biologicals Cat# FAB4841G-100 Anti-mouse CD4 Novus Biologicals Cat# FAB554A-100 Anti-mouse CD8A Novus Biologicals Cat# NBP1-49045PE Anti-mouse CD11b Novus Biologicals Cat# NB110-89474AF405 Anti-mouse CD11c Novus Biologicals Cat# NB110-40766AF488 Anti-mouse CD25 Novus Biologicals Cat# NBP2-27425AF488 Anti-mouse CD28 BioLegend Cat# 100223 Anti-mouse CD44 Novus Biologicals Cat# NBP1-47386APC Anti-mouse CD45 Novus Biologicals Cat# NB100-77417AF488 Anti-mouse CD45 Novus Biologicals Cat# NB100-77417AF405 Anti-mouse CD69 Novus Biologicals Cat# NBP1-28011AF488 Anti-mouse CD80 Novus Biologicals Cat# NBP1-43385AF488 Anti-mouse CD314 Novus Biologicals Cat# FAB1547V-100UG Anti-mouse F4/80 Novus Biologicals Cat# NB600-404APC Anti-mouse FoxP3 Novus Biologicals Cat# NB100-39002PE Anti-human HIF-1a Novus Biologicals Cat# NB100-479 Anti-human HIF-1b Novus Biologicals Cat# NB100-124 Anti-human HIF-2a Novus Biologicals Cat# NB100-122 Anti-mouse IFNG Novus Biologicals Cat# IC485V-100UG Anti-mouse Ly6c Novus Biologicals Cat# NBP1-28046AF488 Anti-mouse Ly6g Novus Biologicals Cat# FAB1037A-100 Anti-mouse NK1.1 Novus Biologicals Cat# NB100-77528APC Anti-mouse p50 Novus Biologicals Cat# NBP2-6735 Anti-mouse Rel A Novus Biologicals Cat# NB100-2176 Anti-mouse Rel B Novus Biologicals Cat# NBP2-20123 Anti-mouse a-Tubulin Novus Biologicals Cat# NB600-506 Armenian Hamster IgG, anti-mouse CXCL9 (MIG) Bio X Cell Cat# BE0309 Polyclonal Armenian hamster IgG Bio X Cell Cat# BE0091 Syrian Hamster IgG, anti-mouse CTLA-4 Bio X Cell Cat# BP0131 Rat IgG2a, k, anti-mouse PD-1 (CD279) Bio X Cell Cat# BP0146 Rat IgG2a isotype control Bio X Cell Cat# BE0089 Chemicals, Peptides, and Recombinant Proteins Acriflavine Sigma Aldrich SKU # A8126 TRIzol Reagent Invitrogen Cat# 15596026 Puromycin Dihydrochloride ThermoFisher Cat# A1113803 ECL Prime Western Blotting System GE Healthcare SKU# GERPN2232 PolyJet In Vitro DNA Transfection Reagent Signagen Cat # SL100688 Rabbit anti-mouse IgG-HRP Santa Cruz Biotech Cat# sc-358914 Rabbit IgG HRP Linked Whole Ab GE Healthcare SKU# GENA934 (Continued on next page) e1 Cell Reports 32, 108073, August 25, 2020

Techniques: Knockdown, Expressing, shRNA

Figure 5. BIRC2 Knockdown in Breast Can- cer Cells Decreases Tumor Growth and Al- ters Inflammatory Cell Recruitment to the Tumor Microenvironment (A) EMT6 subclones expressing NTC or either of two shRNAs targeting BIRC2 (sh4 and sh5) were cultured at 20% O2 and analyzed for expression of BIRC2 protein by immunoblot assay. (B) EMT6 subclones (NTC, sh4, and sh5) were im- planted into the mammary fat pad of female BALB/c mice, and tumor volumes were determined (mean ± SEM; n = 4); *p < 0.05 (Kruskal-Wallis test with Benjamini-Hochberg post-test). (C–F) Tumors were harvested on day 13, and the percentage of CD8+/CD44+/CD69+ activated T cells (C), CD3/NK1.1+ NK cells (D), CD11b+/F4/ 80/CD11c+ DCs (E), and CD11b+/Ly6C+ MDSCs (F) was determined (mean ± SEM; n = 4); *p < 0.05 for the indicated pairs (Kruskal-Wallis test with Benjamini-Hochberg post-test). All immune cell populations were calculated as a percentage of the total number of live cells (based on forward and side scatter). (G) EMT6 subclones were implanted into the mammary fat pad of female SCID mice, and tumor growth was monitored. See also Figure S3B.

Journal: Cell reports

Article Title: BIRC2 Expression Impairs Anti-Cancer Immunity and Immunotherapy Efficacy.

doi: 10.1016/j.celrep.2020.108073

Figure Lengend Snippet: Figure 5. BIRC2 Knockdown in Breast Can- cer Cells Decreases Tumor Growth and Al- ters Inflammatory Cell Recruitment to the Tumor Microenvironment (A) EMT6 subclones expressing NTC or either of two shRNAs targeting BIRC2 (sh4 and sh5) were cultured at 20% O2 and analyzed for expression of BIRC2 protein by immunoblot assay. (B) EMT6 subclones (NTC, sh4, and sh5) were im- planted into the mammary fat pad of female BALB/c mice, and tumor volumes were determined (mean ± SEM; n = 4); *p < 0.05 (Kruskal-Wallis test with Benjamini-Hochberg post-test). (C–F) Tumors were harvested on day 13, and the percentage of CD8+/CD44+/CD69+ activated T cells (C), CD3/NK1.1+ NK cells (D), CD11b+/F4/ 80/CD11c+ DCs (E), and CD11b+/Ly6C+ MDSCs (F) was determined (mean ± SEM; n = 4); *p < 0.05 for the indicated pairs (Kruskal-Wallis test with Benjamini-Hochberg post-test). All immune cell populations were calculated as a percentage of the total number of live cells (based on forward and side scatter). (G) EMT6 subclones were implanted into the mammary fat pad of female SCID mice, and tumor growth was monitored. See also Figure S3B.

Article Snippet: REAGENT or RESOURCE SOURCE IDENTIFIER Antibodies Anti-mouse BIRC2 Novus Biologicals Cat# NB100-56889 Anti-mouse b-Actin Santa Cruz Biotechnology Cat# sc-47778 Anti-mouse CD3 BioLegend Cat# 102102 Anti-mouse CD3 Novus Biologicals Cat# FAB4841G-100 Anti-mouse CD4 Novus Biologicals Cat# FAB554A-100 Anti-mouse CD8A Novus Biologicals Cat# NBP1-49045PE Anti-mouse CD11b Novus Biologicals Cat# NB110-89474AF405 Anti-mouse CD11c Novus Biologicals Cat# NB110-40766AF488 Anti-mouse CD25 Novus Biologicals Cat# NBP2-27425AF488 Anti-mouse CD28 BioLegend Cat# 100223 Anti-mouse CD44 Novus Biologicals Cat# NBP1-47386APC Anti-mouse CD45 Novus Biologicals Cat# NB100-77417AF488 Anti-mouse CD45 Novus Biologicals Cat# NB100-77417AF405 Anti-mouse CD69 Novus Biologicals Cat# NBP1-28011AF488 Anti-mouse CD80 Novus Biologicals Cat# NBP1-43385AF488 Anti-mouse CD314 Novus Biologicals Cat# FAB1547V-100UG Anti-mouse F4/80 Novus Biologicals Cat# NB600-404APC Anti-mouse FoxP3 Novus Biologicals Cat# NB100-39002PE Anti-human HIF-1a Novus Biologicals Cat# NB100-479 Anti-human HIF-1b Novus Biologicals Cat# NB100-124 Anti-human HIF-2a Novus Biologicals Cat# NB100-122 Anti-mouse IFNG Novus Biologicals Cat# IC485V-100UG Anti-mouse Ly6c Novus Biologicals Cat# NBP1-28046AF488 Anti-mouse Ly6g Novus Biologicals Cat# FAB1037A-100 Anti-mouse NK1.1 Novus Biologicals Cat# NB100-77528APC Anti-mouse p50 Novus Biologicals Cat# NBP2-6735 Anti-mouse Rel A Novus Biologicals Cat# NB100-2176 Anti-mouse Rel B Novus Biologicals Cat# NBP2-20123 Anti-mouse a-Tubulin Novus Biologicals Cat# NB600-506 Armenian Hamster IgG, anti-mouse CXCL9 (MIG) Bio X Cell Cat# BE0309 Polyclonal Armenian hamster IgG Bio X Cell Cat# BE0091 Syrian Hamster IgG, anti-mouse CTLA-4 Bio X Cell Cat# BP0131 Rat IgG2a, k, anti-mouse PD-1 (CD279) Bio X Cell Cat# BP0146 Rat IgG2a isotype control Bio X Cell Cat# BE0089 Chemicals, Peptides, and Recombinant Proteins Acriflavine Sigma Aldrich SKU # A8126 TRIzol Reagent Invitrogen Cat# 15596026 Puromycin Dihydrochloride ThermoFisher Cat# A1113803 ECL Prime Western Blotting System GE Healthcare SKU# GERPN2232 PolyJet In Vitro DNA Transfection Reagent Signagen Cat # SL100688 Rabbit anti-mouse IgG-HRP Santa Cruz Biotech Cat# sc-358914 Rabbit IgG HRP Linked Whole Ab GE Healthcare SKU# GENA934 (Continued on next page) e1 Cell Reports 32, 108073, August 25, 2020

Techniques: Knockdown, Expressing, Cell Culture, Western Blot

Figure 6. BIRC2 Knockdown in B16F10 Cells Increases Anti-tumor Immunity by Increasing CXCL9 Expression (A) NTC and BIRC2-KD subclones were implanted into C57BL/6 mice. When BIRC2-KD tumors became palpable, mice were treated with anti-CXCL9 or IgG every 3 days. Tumor volumes were determined (mean ± SEM; n = 4); *p < 0.05 (Kruskal-Wallis test with Benjamini-Hochberg post-test). (B–E) Tumors were harvested on day 35, and the percentage of CD8+ T cells (relative to CD45+ population) (B), CD8+/CD44+/CD69+ T cells (C), CD3/NK1.1+ NK cells (D), and CD11b+/CD11c+/F4/80 DCs (E) was determined (mean ± SEM; n = 4); *p < 0.05 (Kruskal-Wallis test with Benjamini-Hochberg post-test). All immune cell populations (except B) were calculated as a percentage of the total live cells (based on forward and side scatter). (F–H) The Pearson correlation test was performed to compare CXCL9 mRNA expression with CD8+ T cell score (F), NK cell score (G), and DC score (H), using TCGA data from 481 human melanomas. See also Figures S3C and S4.

Journal: Cell reports

Article Title: BIRC2 Expression Impairs Anti-Cancer Immunity and Immunotherapy Efficacy.

doi: 10.1016/j.celrep.2020.108073

Figure Lengend Snippet: Figure 6. BIRC2 Knockdown in B16F10 Cells Increases Anti-tumor Immunity by Increasing CXCL9 Expression (A) NTC and BIRC2-KD subclones were implanted into C57BL/6 mice. When BIRC2-KD tumors became palpable, mice were treated with anti-CXCL9 or IgG every 3 days. Tumor volumes were determined (mean ± SEM; n = 4); *p < 0.05 (Kruskal-Wallis test with Benjamini-Hochberg post-test). (B–E) Tumors were harvested on day 35, and the percentage of CD8+ T cells (relative to CD45+ population) (B), CD8+/CD44+/CD69+ T cells (C), CD3/NK1.1+ NK cells (D), and CD11b+/CD11c+/F4/80 DCs (E) was determined (mean ± SEM; n = 4); *p < 0.05 (Kruskal-Wallis test with Benjamini-Hochberg post-test). All immune cell populations (except B) were calculated as a percentage of the total live cells (based on forward and side scatter). (F–H) The Pearson correlation test was performed to compare CXCL9 mRNA expression with CD8+ T cell score (F), NK cell score (G), and DC score (H), using TCGA data from 481 human melanomas. See also Figures S3C and S4.

Article Snippet: REAGENT or RESOURCE SOURCE IDENTIFIER Antibodies Anti-mouse BIRC2 Novus Biologicals Cat# NB100-56889 Anti-mouse b-Actin Santa Cruz Biotechnology Cat# sc-47778 Anti-mouse CD3 BioLegend Cat# 102102 Anti-mouse CD3 Novus Biologicals Cat# FAB4841G-100 Anti-mouse CD4 Novus Biologicals Cat# FAB554A-100 Anti-mouse CD8A Novus Biologicals Cat# NBP1-49045PE Anti-mouse CD11b Novus Biologicals Cat# NB110-89474AF405 Anti-mouse CD11c Novus Biologicals Cat# NB110-40766AF488 Anti-mouse CD25 Novus Biologicals Cat# NBP2-27425AF488 Anti-mouse CD28 BioLegend Cat# 100223 Anti-mouse CD44 Novus Biologicals Cat# NBP1-47386APC Anti-mouse CD45 Novus Biologicals Cat# NB100-77417AF488 Anti-mouse CD45 Novus Biologicals Cat# NB100-77417AF405 Anti-mouse CD69 Novus Biologicals Cat# NBP1-28011AF488 Anti-mouse CD80 Novus Biologicals Cat# NBP1-43385AF488 Anti-mouse CD314 Novus Biologicals Cat# FAB1547V-100UG Anti-mouse F4/80 Novus Biologicals Cat# NB600-404APC Anti-mouse FoxP3 Novus Biologicals Cat# NB100-39002PE Anti-human HIF-1a Novus Biologicals Cat# NB100-479 Anti-human HIF-1b Novus Biologicals Cat# NB100-124 Anti-human HIF-2a Novus Biologicals Cat# NB100-122 Anti-mouse IFNG Novus Biologicals Cat# IC485V-100UG Anti-mouse Ly6c Novus Biologicals Cat# NBP1-28046AF488 Anti-mouse Ly6g Novus Biologicals Cat# FAB1037A-100 Anti-mouse NK1.1 Novus Biologicals Cat# NB100-77528APC Anti-mouse p50 Novus Biologicals Cat# NBP2-6735 Anti-mouse Rel A Novus Biologicals Cat# NB100-2176 Anti-mouse Rel B Novus Biologicals Cat# NBP2-20123 Anti-mouse a-Tubulin Novus Biologicals Cat# NB600-506 Armenian Hamster IgG, anti-mouse CXCL9 (MIG) Bio X Cell Cat# BE0309 Polyclonal Armenian hamster IgG Bio X Cell Cat# BE0091 Syrian Hamster IgG, anti-mouse CTLA-4 Bio X Cell Cat# BP0131 Rat IgG2a, k, anti-mouse PD-1 (CD279) Bio X Cell Cat# BP0146 Rat IgG2a isotype control Bio X Cell Cat# BE0089 Chemicals, Peptides, and Recombinant Proteins Acriflavine Sigma Aldrich SKU # A8126 TRIzol Reagent Invitrogen Cat# 15596026 Puromycin Dihydrochloride ThermoFisher Cat# A1113803 ECL Prime Western Blotting System GE Healthcare SKU# GERPN2232 PolyJet In Vitro DNA Transfection Reagent Signagen Cat # SL100688 Rabbit anti-mouse IgG-HRP Santa Cruz Biotech Cat# sc-358914 Rabbit IgG HRP Linked Whole Ab GE Healthcare SKU# GENA934 (Continued on next page) e1 Cell Reports 32, 108073, August 25, 2020

Techniques: Knockdown, Expressing

FR-targeting carbon nanospheres locate in tumor associated macrophages (TAMs) in the tumor environment obtained from the subcutaneous GL261 tumor model. The TAMs are isolated using magnetically labeled CD11b-associated micro-beads. (A) Scheme showing the separation method for TAM isolation from a solid tumor. (B) Flow cytometric analyses of tumor-associated surface marker expressions on TAMs isolated from a subcutaneous GL261 tumor in mice. Expression levels of different surface markers (red) on TAMs and their corresponding subtype IgG controls (black) are represented accordingly. (C) The percentages of CD11b + and F4/80+ macrophages simultaneously expressing FRs. (D) Flow cytometric analysis of TAMs isolated from tumor-bearing mice treated with CFD (green), CD (red) and DOX (black). (E) Flow cytometric analysis of differences in CFD uptake in TAMs (green) and TAM-free, isolated tumour cells (blue) from the tumor-bearing mice. (F) Flow cytometric analysis to exhibit the differences in FR-expression levels in TAMs (green) and TAM-free, isolated tumour cells (blue) from the tumor-bearing mice. (G) Confocal microscopy images of TAMs isolated from CFD-, CD- or DOX-treated tumor-bearing mice.

Journal: Nanoscale Advances

Article Title: Dual targeting of folate receptor-expressing glioma tumor-associated macrophages and epithelial cells in the brain using a carbon nanosphere–cationic folate nanoconjugate †

doi: 10.1039/c9na00056a

Figure Lengend Snippet: FR-targeting carbon nanospheres locate in tumor associated macrophages (TAMs) in the tumor environment obtained from the subcutaneous GL261 tumor model. The TAMs are isolated using magnetically labeled CD11b-associated micro-beads. (A) Scheme showing the separation method for TAM isolation from a solid tumor. (B) Flow cytometric analyses of tumor-associated surface marker expressions on TAMs isolated from a subcutaneous GL261 tumor in mice. Expression levels of different surface markers (red) on TAMs and their corresponding subtype IgG controls (black) are represented accordingly. (C) The percentages of CD11b + and F4/80+ macrophages simultaneously expressing FRs. (D) Flow cytometric analysis of TAMs isolated from tumor-bearing mice treated with CFD (green), CD (red) and DOX (black). (E) Flow cytometric analysis of differences in CFD uptake in TAMs (green) and TAM-free, isolated tumour cells (blue) from the tumor-bearing mice. (F) Flow cytometric analysis to exhibit the differences in FR-expression levels in TAMs (green) and TAM-free, isolated tumour cells (blue) from the tumor-bearing mice. (G) Confocal microscopy images of TAMs isolated from CFD-, CD- or DOX-treated tumor-bearing mice.

Article Snippet: Doxorubicin (DOX) was purchased from Alfa Aesar, India, and TAM isolation was performed using a Midi MACS separating kit containing a Midi MACS separator (130-042-302), LS columns (130-042-401) and CD11b micro beads (130-097-142) [Miltenyi Biotech Asia Pacific Pte Ltd, Singapore].

Techniques: Isolation, Labeling, Marker, Expressing, Confocal Microscopy

( A ) Brain tissue pieces were collected from the indicated brain regions and dissociated by mechanical disruption and enzymatic digestion. A CNS single-cell suspension was generated after Percoll separation. CD3 + T cells were positively selected and used for a CNS T cell QVOA. BrMCs and MG were isolated from the CD3 – fractions by CD11b + selection and by TMEM119 + selection, respectively. For human brains, CD11b + selection was performed to isolate BrMCs. BrMCs or MG at P0 (collected immediately after isolation) were used for purity and phenotype analysis and for RT-qPCR to measure proviral DNA and cell-associated RNA. BrMCs or MG at P1 were cultured 1–2 weeks ex vivo to allow the cells to recover and attach. P1 cells were used for the LRA study and the QVOA. ( B ) MG isolated from ART-suppressed, SIV-infected rhesus macaques were defined by TMEM119 staining (P1 MG) (scale bar: 100 μm) and ( C ) anti-TMEM119/anti-CD11b flow cytometry (P0 MG). ( D ) NHP MG proliferated ex vivo. ( E ) Total and integrated SIV DNA was detectable in isolated P0 MG ( n = 3). ( F ) SIV RNA was induced in isolated P1 MG 7 days after stimulation by the HDACi SAHA (500 nM), but was poorly induced by the canonical NF-κB agonist PEP005 (12 nM), the noncanonical NF-κB agonist AZD5582 (100 nM), or TNF-α (50 ng/mL). *** P < 0.001 compared with mock treatment, by 1-way ANOVA ( n = 3). ( G ) SIV RNA was recovered from the supernatant of NHP P1 MG cocultured with CEM174 ( n = 3). Data are presented as the mean ± SEM.

Journal: The Journal of Clinical Investigation

Article Title: Brain microglia serve as a persistent HIV reservoir despite durable antiretroviral therapy

doi: 10.1172/JCI167417

Figure Lengend Snippet: ( A ) Brain tissue pieces were collected from the indicated brain regions and dissociated by mechanical disruption and enzymatic digestion. A CNS single-cell suspension was generated after Percoll separation. CD3 + T cells were positively selected and used for a CNS T cell QVOA. BrMCs and MG were isolated from the CD3 – fractions by CD11b + selection and by TMEM119 + selection, respectively. For human brains, CD11b + selection was performed to isolate BrMCs. BrMCs or MG at P0 (collected immediately after isolation) were used for purity and phenotype analysis and for RT-qPCR to measure proviral DNA and cell-associated RNA. BrMCs or MG at P1 were cultured 1–2 weeks ex vivo to allow the cells to recover and attach. P1 cells were used for the LRA study and the QVOA. ( B ) MG isolated from ART-suppressed, SIV-infected rhesus macaques were defined by TMEM119 staining (P1 MG) (scale bar: 100 μm) and ( C ) anti-TMEM119/anti-CD11b flow cytometry (P0 MG). ( D ) NHP MG proliferated ex vivo. ( E ) Total and integrated SIV DNA was detectable in isolated P0 MG ( n = 3). ( F ) SIV RNA was induced in isolated P1 MG 7 days after stimulation by the HDACi SAHA (500 nM), but was poorly induced by the canonical NF-κB agonist PEP005 (12 nM), the noncanonical NF-κB agonist AZD5582 (100 nM), or TNF-α (50 ng/mL). *** P < 0.001 compared with mock treatment, by 1-way ANOVA ( n = 3). ( G ) SIV RNA was recovered from the supernatant of NHP P1 MG cocultured with CEM174 ( n = 3). Data are presented as the mean ± SEM.

Article Snippet: For NHP samples, CD11b MicroBeads, NHP (catalog 130-091-100, Miltenyi Biotec) were used ( ).

Techniques: Disruption, Suspension, Generated, Isolation, Selection, Quantitative RT-PCR, Cell Culture, Ex Vivo, Infection, Staining, Flow Cytometry

Isolation of glass-adherent CD11b+ macrophages from peripheral blood mononuclear cells (PBMCs). The PBMCs were cultured in a glass dish and cell specific phenotypes were analyzed. “Before’ refers to the phenotype analysis in the freshly collected PBMCs; ‘After’ refer to the phenotype analysis of the glass-adherent cells following 72 h culture and removal of the supernatant and non-adherent cells. After 72 h, the adherent cells were washed three times with fresh RPMI media and used in our further studies to determine the salt-effects. Increased macrophage phenotype (CD11b, A) in the adherent cells, along with decreased CD4+T cells (B), CD8+T cells (C), CD19+B cells (D), CD56+NK cells (E) and MPO (F, myeloperoxidase, leukocyte marker) in the adherent cells. Data represented mean values ± SEM from five independent experiments. Student- t -test performed for statistical analysis (significance p<0.05).

Journal: Biochemistry and Biophysics Reports

Article Title: High salt induces anti-inflammatory MΦ2-like phenotype in peripheral macrophages

doi: 10.1016/j.bbrep.2016.05.009

Figure Lengend Snippet: Isolation of glass-adherent CD11b+ macrophages from peripheral blood mononuclear cells (PBMCs). The PBMCs were cultured in a glass dish and cell specific phenotypes were analyzed. “Before’ refers to the phenotype analysis in the freshly collected PBMCs; ‘After’ refer to the phenotype analysis of the glass-adherent cells following 72 h culture and removal of the supernatant and non-adherent cells. After 72 h, the adherent cells were washed three times with fresh RPMI media and used in our further studies to determine the salt-effects. Increased macrophage phenotype (CD11b, A) in the adherent cells, along with decreased CD4+T cells (B), CD8+T cells (C), CD19+B cells (D), CD56+NK cells (E) and MPO (F, myeloperoxidase, leukocyte marker) in the adherent cells. Data represented mean values ± SEM from five independent experiments. Student- t -test performed for statistical analysis (significance p<0.05).

Article Snippet: Antibodies used for flow cytometry consisted of: CD11b-FITC, CD14-PE, and CD16 − PerCP (Santa Cruz), CD25-PE, Foxp3-PE (eBiosciences, San Diego, CA).

Techniques: Isolation, Cell Culture, Marker

High salt induced macrophage phenotype switch from MΦ1 to MΦ2 in the adherent-PBMCs following treatment with varying salt concentration (0.1–0.3 M NaCl) and equimolar mannitol (0.1 M mannitol+0.1 M NaCl). The basal concentration of NaCl in cuture media is 0.1 M. NaCl concentration below 0.1 M is not viable for cell culture. (A) Cell viability analysis of adherent cells from PBMC cultured for 72 h and latter subjected to various treatment condition mentioned above for 48 h. Frequency of CD11b + CD14 + CD16 low cells (B), and CD11b + CD14 low CD16 + cells (C) following various treatment conditions. Flow cytometry analysis for CD14 (D) and CD16 (E) in the CD11b positively selected cells following various treatment conditions mentioned above. Data represented mean values ± SEM from five independent experiments. Student- t -test performed for statistical analysis (significance p<0.05).

Journal: Biochemistry and Biophysics Reports

Article Title: High salt induces anti-inflammatory MΦ2-like phenotype in peripheral macrophages

doi: 10.1016/j.bbrep.2016.05.009

Figure Lengend Snippet: High salt induced macrophage phenotype switch from MΦ1 to MΦ2 in the adherent-PBMCs following treatment with varying salt concentration (0.1–0.3 M NaCl) and equimolar mannitol (0.1 M mannitol+0.1 M NaCl). The basal concentration of NaCl in cuture media is 0.1 M. NaCl concentration below 0.1 M is not viable for cell culture. (A) Cell viability analysis of adherent cells from PBMC cultured for 72 h and latter subjected to various treatment condition mentioned above for 48 h. Frequency of CD11b + CD14 + CD16 low cells (B), and CD11b + CD14 low CD16 + cells (C) following various treatment conditions. Flow cytometry analysis for CD14 (D) and CD16 (E) in the CD11b positively selected cells following various treatment conditions mentioned above. Data represented mean values ± SEM from five independent experiments. Student- t -test performed for statistical analysis (significance p<0.05).

Article Snippet: Antibodies used for flow cytometry consisted of: CD11b-FITC, CD14-PE, and CD16 − PerCP (Santa Cruz), CD25-PE, Foxp3-PE (eBiosciences, San Diego, CA).

Techniques: Concentration Assay, Cell Culture, Flow Cytometry

Reversal of macrophage phenotype following re-treatment with regular (0.1 M NaCl) salt concentration. The adherent macrophages previously cultured in high salt for 48 h, for another 48 h with reversing to regular media (0.1 M NaCl). The macrophage phenotype for expression of CD14 (A) and CD16 (B) in CD11b selected cells have been analyzed. (C, D) The inflammatory chemokines and cytokines (same cytokines and chemokines analyzed in ) were analyzed for their change in expression pattern following re-treatment in regular salt media; ‘0.1 M NaCl (r)’ refers to reversal of salt concentration back to regular salt containing media in the cells pretreated with high (0.2 M NaCl) salt. Data represented mean values ± SEM from five independent experiments. Student- t -test performed for statistical analysis (significance p<0.05).

Journal: Biochemistry and Biophysics Reports

Article Title: High salt induces anti-inflammatory MΦ2-like phenotype in peripheral macrophages

doi: 10.1016/j.bbrep.2016.05.009

Figure Lengend Snippet: Reversal of macrophage phenotype following re-treatment with regular (0.1 M NaCl) salt concentration. The adherent macrophages previously cultured in high salt for 48 h, for another 48 h with reversing to regular media (0.1 M NaCl). The macrophage phenotype for expression of CD14 (A) and CD16 (B) in CD11b selected cells have been analyzed. (C, D) The inflammatory chemokines and cytokines (same cytokines and chemokines analyzed in ) were analyzed for their change in expression pattern following re-treatment in regular salt media; ‘0.1 M NaCl (r)’ refers to reversal of salt concentration back to regular salt containing media in the cells pretreated with high (0.2 M NaCl) salt. Data represented mean values ± SEM from five independent experiments. Student- t -test performed for statistical analysis (significance p<0.05).

Article Snippet: Antibodies used for flow cytometry consisted of: CD11b-FITC, CD14-PE, and CD16 − PerCP (Santa Cruz), CD25-PE, Foxp3-PE (eBiosciences, San Diego, CA).

Techniques: Concentration Assay, Cell Culture, Expressing

PTEC DN-RAR mice underwent rhabdo or bilateral IRI-AKI, and kidneys harvested after 3 days. A-D, Increased F4/80 staining in the kidney after rhabdo- and IRI-AKI. A/B, F4/80 staining in uninjured mice (Ctrl) and after rhabdo-AKI (Rh-AKI). Area staining with F4/80 in the OSOM, and representative images showing F4/80, Sox9, and LTL staining. Left hand panels show F4/80 staining is largely restricted to the OSOM. Right hand panels show higher magnification of the OSOM. C/D, F4/80 staining after bilateral IRI-AKI. Quantification, and images showing F4/80 and LTL staining in the OSOM. Results expressed as means +/- SEM, individual data points shown. A/C, 1-way ANOVA, if p <0.05, q values shown for between group comparisons. Scale bars=100μM. E-F, Decreased expression of inflammatory markers in CD11B+ cells after IRI-AKI. PTEC DN-RAR mice underwent bilateral IRI-AKI, and bulk RNA seq performed on renal CD11B + cells 3 days after injury. E, Gene set enrichment analysis (GSEA) of downregulated genes using Gene Ontology (GO) datasets. F, GSEA for validated pro-inflammatory (“M1”), and anti-inflammatory (“M2”) gene sets in the RNA seq data. Set size=no. of genes from each gene set that are represented. NES=normalized expression score for the gene set sizes. G/H, Volcano plots showing fold change in expression of core enrichment gene from the CD11B+ bulk RNA seq dataset. Dotted line indicates p<0.05.

Journal: bioRxiv

Article Title: Inhibition of Retinoic Acid Signaling in Proximal Tubular Epithelial cells Protects against Acute Kidney Injury by Enhancing Kim-1-dependent Efferocytosis

doi: 10.1101/2023.06.15.545113

Figure Lengend Snippet: PTEC DN-RAR mice underwent rhabdo or bilateral IRI-AKI, and kidneys harvested after 3 days. A-D, Increased F4/80 staining in the kidney after rhabdo- and IRI-AKI. A/B, F4/80 staining in uninjured mice (Ctrl) and after rhabdo-AKI (Rh-AKI). Area staining with F4/80 in the OSOM, and representative images showing F4/80, Sox9, and LTL staining. Left hand panels show F4/80 staining is largely restricted to the OSOM. Right hand panels show higher magnification of the OSOM. C/D, F4/80 staining after bilateral IRI-AKI. Quantification, and images showing F4/80 and LTL staining in the OSOM. Results expressed as means +/- SEM, individual data points shown. A/C, 1-way ANOVA, if p <0.05, q values shown for between group comparisons. Scale bars=100μM. E-F, Decreased expression of inflammatory markers in CD11B+ cells after IRI-AKI. PTEC DN-RAR mice underwent bilateral IRI-AKI, and bulk RNA seq performed on renal CD11B + cells 3 days after injury. E, Gene set enrichment analysis (GSEA) of downregulated genes using Gene Ontology (GO) datasets. F, GSEA for validated pro-inflammatory (“M1”), and anti-inflammatory (“M2”) gene sets in the RNA seq data. Set size=no. of genes from each gene set that are represented. NES=normalized expression score for the gene set sizes. G/H, Volcano plots showing fold change in expression of core enrichment gene from the CD11B+ bulk RNA seq dataset. Dotted line indicates p<0.05.

Article Snippet: Cells were then incubated with anti-mouse CD11b MACS beads (Miltenyi Biotech, 130-126-725) for 15 minutes, and CD11b+ cells separated by loading cells into MACS separator.

Techniques: Staining, IF-P, Expressing, RNA Sequencing

PTEC DN-RAR mice underwent bilateral IRI-AKI, and bulk RNA seq was performed on CD11B + cells from 3 PEPCK Cre+ and 3 Cre- mouse kidneys 3 days after injury. PCA shows clear separation of Cre+ and Cre- datasets in the first dimension, which accounts for 57% of the variation.

Journal: bioRxiv

Article Title: Inhibition of Retinoic Acid Signaling in Proximal Tubular Epithelial cells Protects against Acute Kidney Injury by Enhancing Kim-1-dependent Efferocytosis

doi: 10.1101/2023.06.15.545113

Figure Lengend Snippet: PTEC DN-RAR mice underwent bilateral IRI-AKI, and bulk RNA seq was performed on CD11B + cells from 3 PEPCK Cre+ and 3 Cre- mouse kidneys 3 days after injury. PCA shows clear separation of Cre+ and Cre- datasets in the first dimension, which accounts for 57% of the variation.

Article Snippet: Cells were then incubated with anti-mouse CD11b MACS beads (Miltenyi Biotech, 130-126-725) for 15 minutes, and CD11b+ cells separated by loading cells into MACS separator.

Techniques: RNA Sequencing

A, CD45 + cells: CD45 vs SSC-A; B, CD45 + single cells: FSC-H vs FSC-A, selected upper line followed by SSC-H vs. SSC-A select upper line; C, Single, CD45 + live cells: DAPI - vs. CD45 + ; D, Exclude CD45 + granulocytes: Ly6G + (granulocytes) and Ly6G - cells (non-granulocytes); E, F4/80 expression in CD11B + ; Ly6G - cells: F4/80 - ; Intermediate (int), 2); high (hi) (3); F-H, Ly6C expression: F, F4/80 - : Ly6C - (1), Int (2), high (3); G, F4/80 Int : Ly6C - (1), Int (2), high (3); H, F4/80 Hi : Ly6C - (1), Int (2), high (3); I-K, MHC-II expression: I, F4/80 - : MHC -- (1), Int (2), high (3); J, F4/80 Int : MHC-II - (1), Int (2), high (3); K, F4/80 Hi : MHC-II - (1), Int (2), high (3).

Journal: bioRxiv

Article Title: Inhibition of Retinoic Acid Signaling in Proximal Tubular Epithelial cells Protects against Acute Kidney Injury by Enhancing Kim-1-dependent Efferocytosis

doi: 10.1101/2023.06.15.545113

Figure Lengend Snippet: A, CD45 + cells: CD45 vs SSC-A; B, CD45 + single cells: FSC-H vs FSC-A, selected upper line followed by SSC-H vs. SSC-A select upper line; C, Single, CD45 + live cells: DAPI - vs. CD45 + ; D, Exclude CD45 + granulocytes: Ly6G + (granulocytes) and Ly6G - cells (non-granulocytes); E, F4/80 expression in CD11B + ; Ly6G - cells: F4/80 - ; Intermediate (int), 2); high (hi) (3); F-H, Ly6C expression: F, F4/80 - : Ly6C - (1), Int (2), high (3); G, F4/80 Int : Ly6C - (1), Int (2), high (3); H, F4/80 Hi : Ly6C - (1), Int (2), high (3); I-K, MHC-II expression: I, F4/80 - : MHC -- (1), Int (2), high (3); J, F4/80 Int : MHC-II - (1), Int (2), high (3); K, F4/80 Hi : MHC-II - (1), Int (2), high (3).

Article Snippet: Cells were then incubated with anti-mouse CD11b MACS beads (Miltenyi Biotech, 130-126-725) for 15 minutes, and CD11b+ cells separated by loading cells into MACS separator.

Techniques: Expressing

Kidneys were harvested from 5 PEPCK Cre+ and 10 Cre- uninjured mice, and from 9 PEPCK Cre+ and 10 Cre- mice 3 days after bilateral IRI-AKI. Tissue was digested and homogenized and evaluated by flow cytometry using antibodies and gating strategy illustrated in . A, Total numbers of live, single CD45+ cells acquired; B, CD11B+ cells; and C, non-granulocytes (CD11B + ; Ly6G - ). Results expressed as means +/- SEM, with individual data points shown. 1-way ANOVA was used to compare between groups, and if p <0.05, q values shown for between group comparisons, corrected for repeated testing.

Journal: bioRxiv

Article Title: Inhibition of Retinoic Acid Signaling in Proximal Tubular Epithelial cells Protects against Acute Kidney Injury by Enhancing Kim-1-dependent Efferocytosis

doi: 10.1101/2023.06.15.545113

Figure Lengend Snippet: Kidneys were harvested from 5 PEPCK Cre+ and 10 Cre- uninjured mice, and from 9 PEPCK Cre+ and 10 Cre- mice 3 days after bilateral IRI-AKI. Tissue was digested and homogenized and evaluated by flow cytometry using antibodies and gating strategy illustrated in . A, Total numbers of live, single CD45+ cells acquired; B, CD11B+ cells; and C, non-granulocytes (CD11B + ; Ly6G - ). Results expressed as means +/- SEM, with individual data points shown. 1-way ANOVA was used to compare between groups, and if p <0.05, q values shown for between group comparisons, corrected for repeated testing.

Article Snippet: Cells were then incubated with anti-mouse CD11b MACS beads (Miltenyi Biotech, 130-126-725) for 15 minutes, and CD11b+ cells separated by loading cells into MACS separator.

Techniques: Flow Cytometry, IF-P

Kidneys were harvested from PTEC DN RAR mice 3 days after bilateral IRI-AKI. Tissue was digested, homogenized, and evaluated by flow cytometry. A/B, F4/80 hi cells (kidney resident macrophages). A, F4/80 hi cells as the % of gated CD11B + CD45 + Ly6G - cells. B, CD11B and F4/80 expression charts in PEPCK Cre+ and Cre- mice after IRI-AKI (% in gated area indicated with *). C-F, Ly6C hi cells (inflammatory monocyte/macrophages) . C, F4/80 - (infiltrating monocytes) Ly6C hi cells, and E, F4/80 int (bone marrow derived macrophages) Ly6C hi cells, as the % of gated F4/80 - and F4/80 int cells, respectively. D/F, CD11B and Ly6C expression charts. G/H, CD206/mannose receptor expression (an M2 activated macrophage marker) . G, CD206 + cells as the % of gated F4/80 hi cells. H, CD11B and CD206 expression charts. Results are expressed as means +/- SEM, with individual datapoints shown. 1-way ANOVA was used to compare between groups, and if p <0.05, q values shown for between group comparisons, corrected for repeated testing.

Journal: bioRxiv

Article Title: Inhibition of Retinoic Acid Signaling in Proximal Tubular Epithelial cells Protects against Acute Kidney Injury by Enhancing Kim-1-dependent Efferocytosis

doi: 10.1101/2023.06.15.545113

Figure Lengend Snippet: Kidneys were harvested from PTEC DN RAR mice 3 days after bilateral IRI-AKI. Tissue was digested, homogenized, and evaluated by flow cytometry. A/B, F4/80 hi cells (kidney resident macrophages). A, F4/80 hi cells as the % of gated CD11B + CD45 + Ly6G - cells. B, CD11B and F4/80 expression charts in PEPCK Cre+ and Cre- mice after IRI-AKI (% in gated area indicated with *). C-F, Ly6C hi cells (inflammatory monocyte/macrophages) . C, F4/80 - (infiltrating monocytes) Ly6C hi cells, and E, F4/80 int (bone marrow derived macrophages) Ly6C hi cells, as the % of gated F4/80 - and F4/80 int cells, respectively. D/F, CD11B and Ly6C expression charts. G/H, CD206/mannose receptor expression (an M2 activated macrophage marker) . G, CD206 + cells as the % of gated F4/80 hi cells. H, CD11B and CD206 expression charts. Results are expressed as means +/- SEM, with individual datapoints shown. 1-way ANOVA was used to compare between groups, and if p <0.05, q values shown for between group comparisons, corrected for repeated testing.

Article Snippet: Cells were then incubated with anti-mouse CD11b MACS beads (Miltenyi Biotech, 130-126-725) for 15 minutes, and CD11b+ cells separated by loading cells into MACS separator.

Techniques: Flow Cytometry, Expressing, Derivative Assay, Marker, IF-P
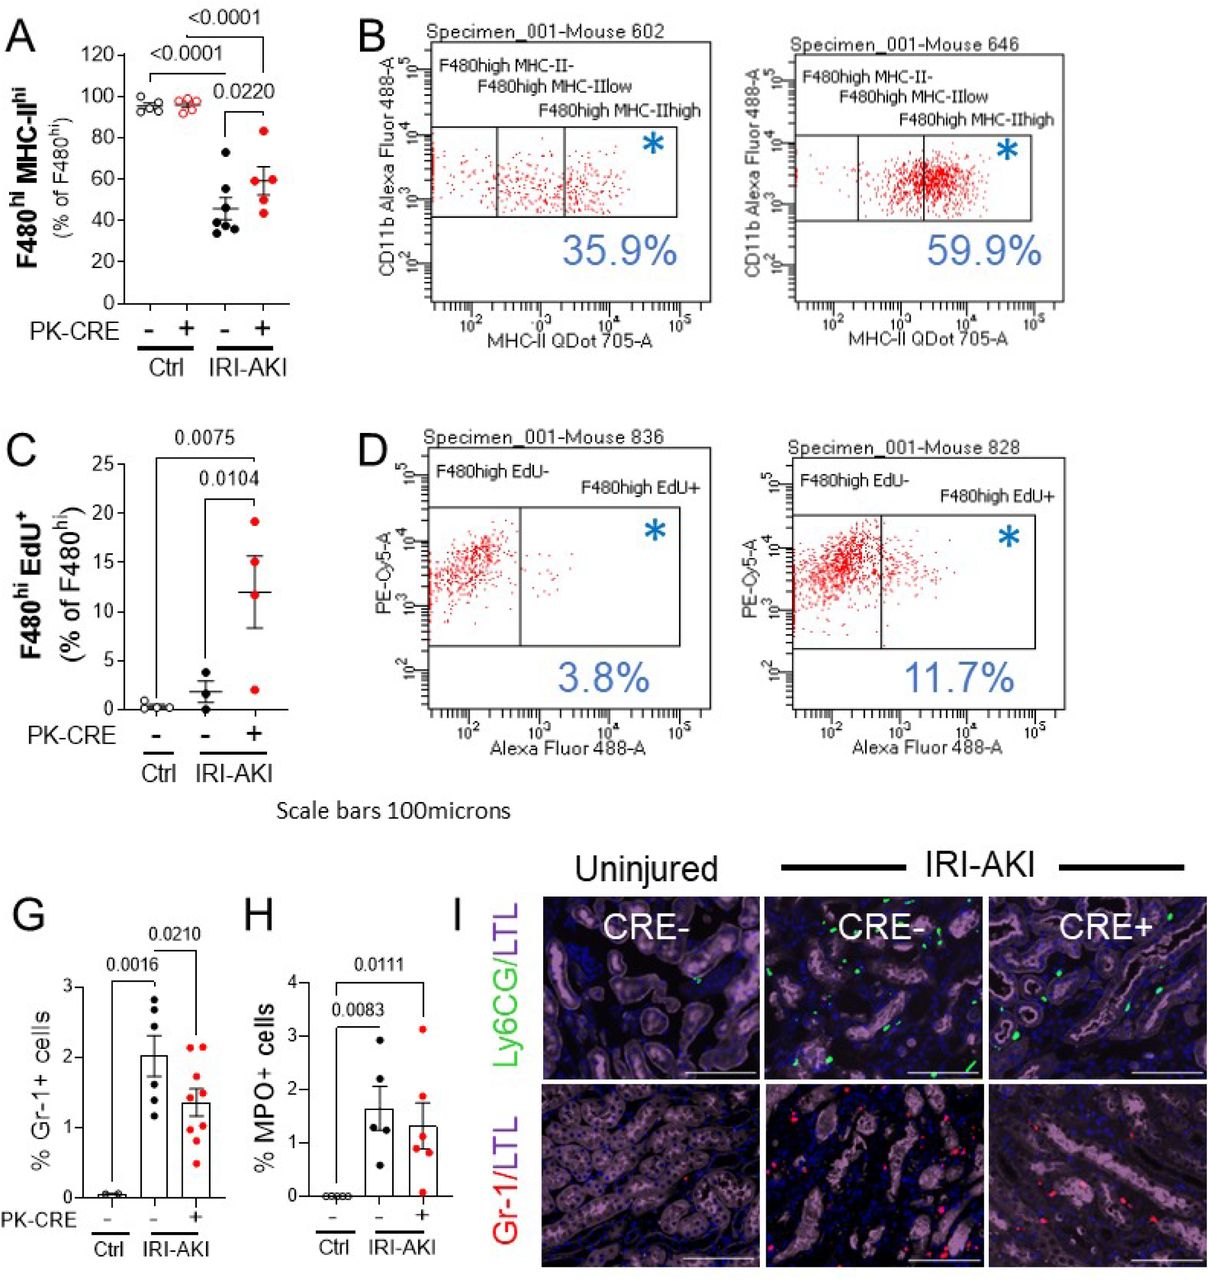
Kidneys were harvested from PTEC DN RAR mice, uninjured and 3 days after bilateral IRI AKI. Tissue was digested, homogenized, and evaluated by flow cytometry. A/B, MHC-II hi F4/80 hi cells (kidney resident macrophages). A, MHC-II hi as the % of gated F4/80 hi cells. B, Representative CD11B and MHC-II expression chart in PEPCK Cre+ and Cre- mice after IRI-AKI (% in gated area indicated with *). C/D, EdU + F4/80 hi cells (proliferating kidney resident macrophages). C, EdU labeled cells as the % of gated F4/80 hi cells. D, Representative CD11B (Y axis) and EdU (X-axis) staining charts. E/F, Immunofluorescence staining with monocyte and neutrophil markers, Gr-1 and MPO. Kidneys were harvested from PTEC DN RAR mice 3 days after bilateral IRI-AKI and co-labeled with LTL and either Gr-1 (a marker of activated monocytes and neutrophils), or MPO (a marker of neutrophils) antibodies. G/H, G, Quantification of the Gr-1 and MPO+ cells as the % of the total cells counted. Results are expressed as means +/- SEM, with individual datapoints shown. 1-way ANOVA used to compare between groups, and if p <0.05, q values shown for between group comparisons, corrected for repeated testing.

Journal: bioRxiv

Article Title: Inhibition of Retinoic Acid Signaling in Proximal Tubular Epithelial cells Protects against Acute Kidney Injury by Enhancing Kim-1-dependent Efferocytosis

doi: 10.1101/2023.06.15.545113

Figure Lengend Snippet: Kidneys were harvested from PTEC DN RAR mice, uninjured and 3 days after bilateral IRI AKI. Tissue was digested, homogenized, and evaluated by flow cytometry. A/B, MHC-II hi F4/80 hi cells (kidney resident macrophages). A, MHC-II hi as the % of gated F4/80 hi cells. B, Representative CD11B and MHC-II expression chart in PEPCK Cre+ and Cre- mice after IRI-AKI (% in gated area indicated with *). C/D, EdU + F4/80 hi cells (proliferating kidney resident macrophages). C, EdU labeled cells as the % of gated F4/80 hi cells. D, Representative CD11B (Y axis) and EdU (X-axis) staining charts. E/F, Immunofluorescence staining with monocyte and neutrophil markers, Gr-1 and MPO. Kidneys were harvested from PTEC DN RAR mice 3 days after bilateral IRI-AKI and co-labeled with LTL and either Gr-1 (a marker of activated monocytes and neutrophils), or MPO (a marker of neutrophils) antibodies. G/H, G, Quantification of the Gr-1 and MPO+ cells as the % of the total cells counted. Results are expressed as means +/- SEM, with individual datapoints shown. 1-way ANOVA used to compare between groups, and if p <0.05, q values shown for between group comparisons, corrected for repeated testing.

Article Snippet: Cells were then incubated with anti-mouse CD11b MACS beads (Miltenyi Biotech, 130-126-725) for 15 minutes, and CD11b+ cells separated by loading cells into MACS separator.

Techniques: Flow Cytometry, Expressing, Labeling, Staining, Immunofluorescence, Marker, IF-P

( A ) Schematic mechanism of action of afatinib, UNC2025, and pemigatinib. ( B ) Ccl2 , Ccl5 , Tnf , Nos2 , Lif , and Ngf expression, quantified by reverse transcriptase qPCR (RT-qPCR) in primary mouse astrocytes after stimulation (stim) with TNF-α and IL-1β, IL-6, IFN-γ, or GM-CSF with or without afatinib, UNC2025, and pemigatinib; n = 4 per group. Two-way ANOVA with Dunnett’s multiple comparisons test. ( C ) iNOS, TNF-α, GM-CSF, and Ki-67 were quantified by intracellular flow cytometry of primary mouse astrocytes after stim with TNF-α and IL-1β with or without afatinib, UNC2025, and pemigatinib. Data are representative for n = 2 independent experiments with n = 4 per group. One-way ANOVA with Dunnett’s multiple comparisons test; data are reported as mean ± SD. ( D ) ELISA measurement of NGF and BDNF produced by primary mouse astrocytes after stim with TNF-α and IL-1β with or without afatinib, UNC2025, and pemigatinib; n = 2. One-way ANOVA with Dunnett’s multiple comparisons test; data are reported as mean ± SD. ( E ) CCL2 , NOS2 , and LIF expression quantified by RT-qPCR in human astrocytes with or without stim with TNF-α and IL-1β with or without afatinib, UNC2025, and pemigatinib; n = 4. One-way ANOVA with Dunnett’s multiple comparisons test; data are reported as mean ± SD. ( F ) Relative expression of Il6 , and Ccl2 in primary mouse microglia quantified by RT-qPCR after stim with ACM derived from unstimulated and stim (TNF-α and IL-1β) primary mouse astrocytes with or without afatinib, UNC2025, and pemigatinib; n = 3. One-way ANOVA with Dunnett’s multiple comparisons test; data are reported as mean ± SD. ( G ) Annexin V propidium iodide apoptosis assay of neuronal N2A cells stimulated with ACM; n = 3. Cells were categorized as in early or late apoptosis. One-way ANOVA with Dunnett’s multiple comparisons test; data are reported as mean ± SD. ( H ) Migration assay of CD11b + myeloid cells stimulated with ACM; n = 3. One-way ANOVA with Dunnett’s multiple comparisons test; data are reported as mean ± SD. * P < 0.05; ** P < 0.01; *** P < 0.001; **** P < 0.0001.

Journal: JCI Insight

Article Title: Intranasal delivery of a small-molecule ErbB inhibitor promotes recovery from acute and late-stage CNS inflammation

doi: 10.1172/jci.insight.154824

Figure Lengend Snippet: ( A ) Schematic mechanism of action of afatinib, UNC2025, and pemigatinib. ( B ) Ccl2 , Ccl5 , Tnf , Nos2 , Lif , and Ngf expression, quantified by reverse transcriptase qPCR (RT-qPCR) in primary mouse astrocytes after stimulation (stim) with TNF-α and IL-1β, IL-6, IFN-γ, or GM-CSF with or without afatinib, UNC2025, and pemigatinib; n = 4 per group. Two-way ANOVA with Dunnett’s multiple comparisons test. ( C ) iNOS, TNF-α, GM-CSF, and Ki-67 were quantified by intracellular flow cytometry of primary mouse astrocytes after stim with TNF-α and IL-1β with or without afatinib, UNC2025, and pemigatinib. Data are representative for n = 2 independent experiments with n = 4 per group. One-way ANOVA with Dunnett’s multiple comparisons test; data are reported as mean ± SD. ( D ) ELISA measurement of NGF and BDNF produced by primary mouse astrocytes after stim with TNF-α and IL-1β with or without afatinib, UNC2025, and pemigatinib; n = 2. One-way ANOVA with Dunnett’s multiple comparisons test; data are reported as mean ± SD. ( E ) CCL2 , NOS2 , and LIF expression quantified by RT-qPCR in human astrocytes with or without stim with TNF-α and IL-1β with or without afatinib, UNC2025, and pemigatinib; n = 4. One-way ANOVA with Dunnett’s multiple comparisons test; data are reported as mean ± SD. ( F ) Relative expression of Il6 , and Ccl2 in primary mouse microglia quantified by RT-qPCR after stim with ACM derived from unstimulated and stim (TNF-α and IL-1β) primary mouse astrocytes with or without afatinib, UNC2025, and pemigatinib; n = 3. One-way ANOVA with Dunnett’s multiple comparisons test; data are reported as mean ± SD. ( G ) Annexin V propidium iodide apoptosis assay of neuronal N2A cells stimulated with ACM; n = 3. Cells were categorized as in early or late apoptosis. One-way ANOVA with Dunnett’s multiple comparisons test; data are reported as mean ± SD. ( H ) Migration assay of CD11b + myeloid cells stimulated with ACM; n = 3. One-way ANOVA with Dunnett’s multiple comparisons test; data are reported as mean ± SD. * P < 0.05; ** P < 0.01; *** P < 0.001; **** P < 0.0001.

Article Snippet: To increase purity, both the adherent astrocyte fraction and the shake-off fraction underwent CD11b + magnetic cell separation (Miltenyi, 130-049-601).

Techniques: Expressing, Reverse Transcription, Quantitative RT-PCR, Flow Cytometry, Enzyme-linked Immunosorbent Assay, Produced, Derivative Assay, Modified Annexin V/Propidium Iodide Apoptosis Assay, Migration

( A and B ) Clinical course (left) and linear regression analysis (right) of EAE in mice after daily i.n. treatment with vehicle, afatinib ( A ), or pemigatinib ( B ) starting from symptom onset. The experiment was repeated twice. Vehicle (PBS), n = 10; afatinib, n = 10; pemigatinib, n = 10. Data are reported as mean ± SEM. ( C ) Unsupervised clustering t-distributed stochastic neighbor embedding (t-SNE) plot overlaid with cluster and their abundance ( D ) identified by unsupervised PhenoGraph clustering of high-dimensional flow cytometry data obtained from CNS (brain and spinal cord) tissue at peak of disease from mice treated with afatinib ( n = 5) or vehicle ( n = 5). ( E and F ) Quantification ( E ) and scatter plots ( F ) of CD45 – CD11b – , CD45 int CD11b + , CD45 hi CD11b + , and CD45 + CD11b – cell populations in the CNS of mice treated with afatinib ( n = 5) or vehicle ( n = 5) at peak of disease. Two-way ANOVA with Šidák’s multiple comparisons test. ( G ) Significant differences in CNS-resident and -infiltrating cell populations in mice treated with afatinib ( n = 5) or vehicle ( n = 5) at peak of disease, identified by SAM analysis (FDR cutoff, 0.1). ( H and I ) Intracellular flow cytometry quantification of iNOS, TNF-α, and GM-CSF in astrocytes ( H ) and microglia ( I ) in mice treated with afatinib ( n = 5) or vehicle ( n = 5) at peak of disease. ( J ) Relative expression of Ccl2 , Ccl3 , CCl5 , and Cxcl10 in ACSA2 + -sorted astrocytes after i.n. treatment with afatinib ( n = 5) or vehicle ( n = 5). Unpaired t test with Welch’s correction. Data are reported as mean ± SD. * P < 0.05; ** P < 0.01.

Journal: JCI Insight

Article Title: Intranasal delivery of a small-molecule ErbB inhibitor promotes recovery from acute and late-stage CNS inflammation

doi: 10.1172/jci.insight.154824

Figure Lengend Snippet: ( A and B ) Clinical course (left) and linear regression analysis (right) of EAE in mice after daily i.n. treatment with vehicle, afatinib ( A ), or pemigatinib ( B ) starting from symptom onset. The experiment was repeated twice. Vehicle (PBS), n = 10; afatinib, n = 10; pemigatinib, n = 10. Data are reported as mean ± SEM. ( C ) Unsupervised clustering t-distributed stochastic neighbor embedding (t-SNE) plot overlaid with cluster and their abundance ( D ) identified by unsupervised PhenoGraph clustering of high-dimensional flow cytometry data obtained from CNS (brain and spinal cord) tissue at peak of disease from mice treated with afatinib ( n = 5) or vehicle ( n = 5). ( E and F ) Quantification ( E ) and scatter plots ( F ) of CD45 – CD11b – , CD45 int CD11b + , CD45 hi CD11b + , and CD45 + CD11b – cell populations in the CNS of mice treated with afatinib ( n = 5) or vehicle ( n = 5) at peak of disease. Two-way ANOVA with Šidák’s multiple comparisons test. ( G ) Significant differences in CNS-resident and -infiltrating cell populations in mice treated with afatinib ( n = 5) or vehicle ( n = 5) at peak of disease, identified by SAM analysis (FDR cutoff, 0.1). ( H and I ) Intracellular flow cytometry quantification of iNOS, TNF-α, and GM-CSF in astrocytes ( H ) and microglia ( I ) in mice treated with afatinib ( n = 5) or vehicle ( n = 5) at peak of disease. ( J ) Relative expression of Ccl2 , Ccl3 , CCl5 , and Cxcl10 in ACSA2 + -sorted astrocytes after i.n. treatment with afatinib ( n = 5) or vehicle ( n = 5). Unpaired t test with Welch’s correction. Data are reported as mean ± SD. * P < 0.05; ** P < 0.01.

Article Snippet: To increase purity, both the adherent astrocyte fraction and the shake-off fraction underwent CD11b + magnetic cell separation (Miltenyi, 130-049-601).

Techniques: Flow Cytometry, Expressing

FIGURE 2 Representative images of skeletal muscle immunohistochemistry. (A) Skeletal muscle macrophages were identified using antibodies against CD11b (green) and CD206 (red); CD11b+/CD206+ cells were counted (white arrows). (B) Satellite cells were identified using a Pax7 antibody (red) within the laminin border (green); satellite cells were expressed per fiber. Muscle fiber cross-sectional area was measured in these images. (C) Myonuclei (gold arrows) were identified as DAPI+ (blue) nuclei within the dystrophin border (green). (D) Capillaries were identified using fluorescently conjugated lectin (pink) with a laminin antibody to outline fibers (green) and measured per fiber (yellow arrows). Scale bar = 100 μm for (A), (B), and (D); scale bar = 20 μm in (C)

Journal: The FASEB Journal

Article Title: A muscle cell‐macrophage axis involving matrix metalloproteinase 14 facilitates extracellular matrix remodeling with mechanical loading

doi: 10.1096/fj.202100182rr

Figure Lengend Snippet: FIGURE 2 Representative images of skeletal muscle immunohistochemistry. (A) Skeletal muscle macrophages were identified using antibodies against CD11b (green) and CD206 (red); CD11b+/CD206+ cells were counted (white arrows). (B) Satellite cells were identified using a Pax7 antibody (red) within the laminin border (green); satellite cells were expressed per fiber. Muscle fiber cross-sectional area was measured in these images. (C) Myonuclei (gold arrows) were identified as DAPI+ (blue) nuclei within the dystrophin border (green). (D) Capillaries were identified using fluorescently conjugated lectin (pink) with a laminin antibody to outline fibers (green) and measured per fiber (yellow arrows). Scale bar = 100 μm for (A), (B), and (D); scale bar = 20 μm in (C)

Article Snippet: Slides were incubated with mouse IgG1 anti- CD11b (1:100, Cell Sciences) in 2.5% normal horse serum (NHS, Vector Laboratories, Burlingame, CA, USA) overnight at 4°C.

Techniques: Immunohistochemistry

FIGURE 7 LIF modulates Mmp14 expression and type I collagen degradation rates in vitro. (A) CM from E(+) and E(−) myotubes was pre-treated with 0.1 μg/ml of human anti-LIF neutralizing antibody or IgG control antibody (LIFAb(+/−) followed by incubation with BMDM for 24 h. Cells were collected, RNA isolated, and Mmp14 expression quantified by qPCR (*p < .05). N = 6. Results are expressed as fold change from the control group; E(−)LIFAb(−). (B) DQ type I collagen substrate was used to measure the degradation rates by BMDM in the presence of myotube CM. BMDMs had a significant effect on type I collagen degradation compared to CM alone (#p < .05). E(+) CM treatment of BMDM (E(+)LIFAb(−)) had a significant effect above that observed in control group (E(−)LIFAb(−), *p < .05, #p < .05) compared to CM (*p < .05). N = 3. All analyses were performed using one-way repeated measures ANOVA with Sidak's correction for multiple comparisons. Data presented as mean ± SEM. BMDM, bone marrow-derived macrophages; CM, conditioned media; E(+/−), electrical pulse stimulation; LIF, leukemia inhibitory factor; LIFAb, LIF neutralizing antibody; Mmp14, matrix metalloproteinase 14; qPCR, real-time PCR

Journal: The FASEB Journal

Article Title: A muscle cell‐macrophage axis involving matrix metalloproteinase 14 facilitates extracellular matrix remodeling with mechanical loading

doi: 10.1096/fj.202100182rr

Figure Lengend Snippet: FIGURE 7 LIF modulates Mmp14 expression and type I collagen degradation rates in vitro. (A) CM from E(+) and E(−) myotubes was pre-treated with 0.1 μg/ml of human anti-LIF neutralizing antibody or IgG control antibody (LIFAb(+/−) followed by incubation with BMDM for 24 h. Cells were collected, RNA isolated, and Mmp14 expression quantified by qPCR (*p < .05). N = 6. Results are expressed as fold change from the control group; E(−)LIFAb(−). (B) DQ type I collagen substrate was used to measure the degradation rates by BMDM in the presence of myotube CM. BMDMs had a significant effect on type I collagen degradation compared to CM alone (#p < .05). E(+) CM treatment of BMDM (E(+)LIFAb(−)) had a significant effect above that observed in control group (E(−)LIFAb(−), *p < .05, #p < .05) compared to CM (*p < .05). N = 3. All analyses were performed using one-way repeated measures ANOVA with Sidak's correction for multiple comparisons. Data presented as mean ± SEM. BMDM, bone marrow-derived macrophages; CM, conditioned media; E(+/−), electrical pulse stimulation; LIF, leukemia inhibitory factor; LIFAb, LIF neutralizing antibody; Mmp14, matrix metalloproteinase 14; qPCR, real-time PCR

Article Snippet: Slides were incubated with mouse IgG1 anti- CD11b (1:100, Cell Sciences) in 2.5% normal horse serum (NHS, Vector Laboratories, Burlingame, CA, USA) overnight at 4°C.

Techniques: Expressing, In Vitro, Control, Incubation, Isolation, Derivative Assay, Real-time Polymerase Chain Reaction

( a-e ) Increasing numbers of MDMs in the injured spinal cord correlates with reduced phagocytosis by microglia. Myeloid cells were isolated from the uninjured or injured spinal cord of LysM-eGFP mice and immediately treated with pHrodo- labeled myelin for four hours. ( a ) Flow cytometry gates to isolate microglia/macrophage populations exclude Ly6G+ neutrophils. ( b-d ) Representative flow cytometry dot plots show proportions of CD11b + /LysM-eGFP −ve (microglia) and CD11b + /LysM-eGFP +ve (macrophages) in uninjured or SCI tissue, 1 and 3 d after injury. Bottom panels show representative plots of microglia positive for pHrodo-myelin. ( e ) Graph shows reduced phagocytosis by microglia, with increasing presence of MDMs post-SCI. ( f-i ) In vitro bilaminar coculture of adult mouse microglia and macrophages. Representative FACS plots show uptake of pHrodo-labeled myelin in microglia ( f ) or macrophages (Mϕ) ( h ) alone (left panels) or cells in coculture (right). Graphs showing that phagocytosis is significantly decreased in microglia in the presence of Mϕ compared to microglia alone ( g ), and significantly increased in macrophages in the presence of microglia ( i ). ( j-m ) The bilaminar culture system was used to assess microglia–macrophage communication on inflammatory gene expression in adult mouse and human cells. ( j ) Adult mouse microglial gene expression of four key inflammatory cytokines (IL-1β, TNF, IL-6, and IL-10) treated with LPS (100 ng/mL) in the presence or absence of macrophages (Mϕ). ( k ) Adult mouse macrophage gene expression in the presence or absence of adult mouse microglia. (l ) Adult human microglial gene expression in the presence or absence of human macrophages. ( m ) Adult human macrophage gene expression in the presence or absence of adult human microglia. Statistical analysis for ( e ), one-way ANOVA with Bonferroni corrections ( n = 3); ( g, i ) Student t test ( n = 4). ( j-m ) Two-way ANOVA with Bonferroni corrections ( n = 3–6), mean ± SEM, * p < 0.05; ** p < 0.01; *** p < 0.001. Corresponding raw data . FACS, fluorescently activated cell sorting; IL, interleukin; LPS, lipopolysaccharide; MDM, monocyte-derived macrophage; SCI, spinal cord injury; TNF, Tumor necrosis factor.

Journal: PLoS Biology

Article Title: Peripherally derived macrophages modulate microglial function to reduce inflammation after CNS injury

doi: 10.1371/journal.pbio.2005264

Figure Lengend Snippet: ( a-e ) Increasing numbers of MDMs in the injured spinal cord correlates with reduced phagocytosis by microglia. Myeloid cells were isolated from the uninjured or injured spinal cord of LysM-eGFP mice and immediately treated with pHrodo- labeled myelin for four hours. ( a ) Flow cytometry gates to isolate microglia/macrophage populations exclude Ly6G+ neutrophils. ( b-d ) Representative flow cytometry dot plots show proportions of CD11b + /LysM-eGFP −ve (microglia) and CD11b + /LysM-eGFP +ve (macrophages) in uninjured or SCI tissue, 1 and 3 d after injury. Bottom panels show representative plots of microglia positive for pHrodo-myelin. ( e ) Graph shows reduced phagocytosis by microglia, with increasing presence of MDMs post-SCI. ( f-i ) In vitro bilaminar coculture of adult mouse microglia and macrophages. Representative FACS plots show uptake of pHrodo-labeled myelin in microglia ( f ) or macrophages (Mϕ) ( h ) alone (left panels) or cells in coculture (right). Graphs showing that phagocytosis is significantly decreased in microglia in the presence of Mϕ compared to microglia alone ( g ), and significantly increased in macrophages in the presence of microglia ( i ). ( j-m ) The bilaminar culture system was used to assess microglia–macrophage communication on inflammatory gene expression in adult mouse and human cells. ( j ) Adult mouse microglial gene expression of four key inflammatory cytokines (IL-1β, TNF, IL-6, and IL-10) treated with LPS (100 ng/mL) in the presence or absence of macrophages (Mϕ). ( k ) Adult mouse macrophage gene expression in the presence or absence of adult mouse microglia. (l ) Adult human microglial gene expression in the presence or absence of human macrophages. ( m ) Adult human macrophage gene expression in the presence or absence of adult human microglia. Statistical analysis for ( e ), one-way ANOVA with Bonferroni corrections ( n = 3); ( g, i ) Student t test ( n = 4). ( j-m ) Two-way ANOVA with Bonferroni corrections ( n = 3–6), mean ± SEM, * p < 0.05; ** p < 0.01; *** p < 0.001. Corresponding raw data . FACS, fluorescently activated cell sorting; IL, interleukin; LPS, lipopolysaccharide; MDM, monocyte-derived macrophage; SCI, spinal cord injury; TNF, Tumor necrosis factor.

Article Snippet: Following centrifugation (400 g ; 45 minutes), myelin was removed, and pure populations of microglial cells were selected using CD11b microbeads (Miltenyi #130-093-634), as previously described [ , ].

Techniques: Isolation, Labeling, Flow Cytometry, In Vitro, Gene Expression, FACS, Derivative Assay

( a-d ) The bilaminar culture system was used to assess expression of inducible mPGES and EP2 receptor in adult mouse and human microglia and HPGD expression in human macrophages. ( e ) mPGES and EP2 receptor mRNA expression in FAC-sorted cells 1–5 days after SCI in mice. ( f ) Adult mouse microglial mRNA expression of four key inflammatory cytokines (IL-1β, TNF, IL-6, and IL-10) treated with LPS (100 ng/mL) in the presence or absence of EP2 agonist, Butaprost (1 μM). ( g ) Phagocytosis of pHrodo-labeled myelin by adult mouse microglia is reduced by pretreatment with Butaprost (1 μM; one hour). ( h ) Phagocytosis of pHrodo-labeled myelin by adult mouse microglia, either alone or in the presence of macrophages (Mϕ) treated with vehicle or EP2 receptor antagonist, PF-0441894 (10 μM). ( i ) Phagocytosis of pHrodo-labeled myelin by adult mouse microglia alone or in the presence of WT macrophages or macrophages from mPGES −/− mice. Statistical analysis for ( a-d, f ), two-way ANOVA with Bonferroni corrections ( n = 3–4), and ( e, g-i ), one-way ANOVA with Bonferroni corrections ( n = 3–4). Mean ± SEM. * p < 0.05; ** p < 0.01; *** p < 0.001. Corresponding raw data . FAC, fluorescently activated cell; HPGD, hydroxyprostaglandin dehydrogenase; IL, interleukin; LPS, lipopolysaccharide; mPGES, microsomal prostaglandin E synthase-1; PGE 2 , prostaglandin E 2 ; SCI, spinal cord injury; TNF, tumor necrosis factor; WT, wild-type.

Journal: PLoS Biology

Article Title: Peripherally derived macrophages modulate microglial function to reduce inflammation after CNS injury

doi: 10.1371/journal.pbio.2005264

Figure Lengend Snippet: ( a-d ) The bilaminar culture system was used to assess expression of inducible mPGES and EP2 receptor in adult mouse and human microglia and HPGD expression in human macrophages. ( e ) mPGES and EP2 receptor mRNA expression in FAC-sorted cells 1–5 days after SCI in mice. ( f ) Adult mouse microglial mRNA expression of four key inflammatory cytokines (IL-1β, TNF, IL-6, and IL-10) treated with LPS (100 ng/mL) in the presence or absence of EP2 agonist, Butaprost (1 μM). ( g ) Phagocytosis of pHrodo-labeled myelin by adult mouse microglia is reduced by pretreatment with Butaprost (1 μM; one hour). ( h ) Phagocytosis of pHrodo-labeled myelin by adult mouse microglia, either alone or in the presence of macrophages (Mϕ) treated with vehicle or EP2 receptor antagonist, PF-0441894 (10 μM). ( i ) Phagocytosis of pHrodo-labeled myelin by adult mouse microglia alone or in the presence of WT macrophages or macrophages from mPGES −/− mice. Statistical analysis for ( a-d, f ), two-way ANOVA with Bonferroni corrections ( n = 3–4), and ( e, g-i ), one-way ANOVA with Bonferroni corrections ( n = 3–4). Mean ± SEM. * p < 0.05; ** p < 0.01; *** p < 0.001. Corresponding raw data . FAC, fluorescently activated cell; HPGD, hydroxyprostaglandin dehydrogenase; IL, interleukin; LPS, lipopolysaccharide; mPGES, microsomal prostaglandin E synthase-1; PGE 2 , prostaglandin E 2 ; SCI, spinal cord injury; TNF, tumor necrosis factor; WT, wild-type.

Article Snippet: Following centrifugation (400 g ; 45 minutes), myelin was removed, and pure populations of microglial cells were selected using CD11b microbeads (Miltenyi #130-093-634), as previously described [ , ].

Techniques: Expressing, Labeling